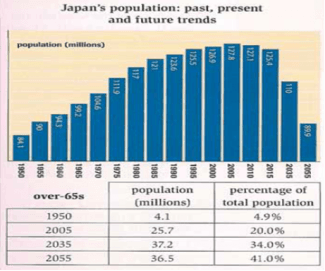
The chart and table below give information about population figures in Japan. Summarise the information by selecting and reporting the main features and make comparisons where relevant.

The given chart
graph
illustrates growth
number of Correct article usage
the growth
japon
Change the capitalization
Japon
citizen
every five years until 2055 Fix the agreement mistake
citizens
while
, the table compares over
65 years old Correct article usage
the over
population
and percentage
of Correct article usage
the percentage
total
Add an article
the total
population
between 1950 and 2055. A glance at the graphs reveals that japon
Change the capitalization
Japon
population
growth increased 2005
. Change preposition
in 2005
According to
first
Change the article
the first
graph
, the population
is falling in 2055.
The japon
Change the capitalization
Japon
population
steadly
soared from 84.1 Correct your spelling
steadily
millon
to 127 billion which the Correct your spelling
million
population
recieved
Correct your spelling
received
a
highest point of capacity. After following one decade, the citizen number decreased Change the article
the
gradual
decrease to Change the word
gradually
reached
125.4 Wrong verb form
reach
millon
.Correct your spelling
million
According to
graph
prediction that the Correct article usage
the graph
population
will lose huge
number of Change the article
a huge
the huge
citizen
until 2055 which is 89.9 million Fix the agreement mistake
citizens
people
.
Moreover
, the graph
table unearth
Change the verb form
unearths
Correct article usage
a comparision
comparision
of Correct your spelling
comparison
Comparision
older
Add an article
the older
population
between
total Correct word choice
and between
population
. between 1950 and 2035 , the elder population
rise sharply, then
there will be reached highest geriatric
Correct quantifier usage
number of geriatric
people
in 2055 while
, the population
will reduce significantly in same
years.
in short, Correct article usage
the same
japonies
elder Correct your spelling
Japanese
people
will cover the majority of population
in the future. The elder Add an article
the population
people
has
Change the verb form
have
effect
on Add an article
an effect
unfavourable
growth of Correct article usage
the unfavourable
population
.Correct article usage
the population
Submitted by jgjgjgjgjdsasx on
Unauthorized use and/or duplication of this material without express and written permission from this site’s author and/or owner is strictly prohibited. Excerpts and links may be used, provided that full and clear credit is given to Writing9 with appropriate and specific direction to the original content.
Linking words: Don't use the same linking words: "according to, while".
▼
Vocabulary: Replace the words graph, population, people with synonyms.
▼
Vocabulary: Rephrase the word "give" in your introduction.
▼
Vocabulary: The word "table" was used 2 times.
▼
Vocabulary: The word "graph" was used 5 times.
▼
Vocabulary: The word "number of" was used 2 times.
▼
Vocabulary: The word "decreased" was used 2 times.
▼
Vocabulary: The word "growth" was used 3 times.
▼
Vocabulary: The word "reached" was used 2 times.
▼