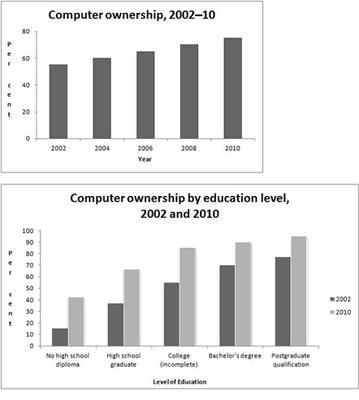
The graphs above give information about computer ownership as a percentage of the population between 2002 and 2010, and by level of education for the years 2002 and 2010

The first graph below bar graphs provides information about the population in 5 different years
computer
ownership percentage in term
ofFix the agreement mistake
terms
Add an article
the
while
the second
chart describes the possession of computer
on the basis of education level in two different years 2002 and 2010.
Fix the agreement mistake
computers
Overall
, it can be observed from the graph, the popularity of central
processing Correct article usage
the central
unit
increased over the given period. Fix the agreement mistake
units
Similarly
, CPU ownership by literacy rate a
follows a growing trend. It can be deduced from the given information, the percentage of desktops owned by people in all education Correct article usage
apply
category
in 2010 are higher Fix the agreement mistake
categories
while
compared to 2002.The educational institutes which have Correct word choice
apply
a
Correct article usage
apply
post graduate
Correct your spelling
postgraduate
qualification
had a larger number of computers than other institutions.
In terms of Fix the agreement mistake
qualifications
computer
ownership by population, it is
gradually grew from over 45% in 2002 to above 70% in 2010.Unnecessary verb
apply
Furthermore
, in 2002 the computer
owned by high school
accounted for 10%, Fix the agreement mistake
schools
whereas
above 45% of schools holding
PC in 2010.Wrong verb form
held
Computer
procession was very high in postgraduate qualification colleges,which accounted above
75% in 2002 Change preposition
for above
while
this
value rose above 90% in 2010.All
other institutes like Change preposition
For all
collage
, high Correct your spelling
college
school
, and bachelor’s degree institutions the Fix the agreement mistake
schools
computer
procession figure increased significantly in 2010 while
compared to 2002.Correct word choice
apply
Submitted by preethikishre on
Unauthorized use and/or duplication of this material without express and written permission from this site’s author and/or owner is strictly prohibited. Excerpts and links may be used, provided that full and clear credit is given to Writing9 with appropriate and specific direction to the original content.
Linking words: Don't use the same linking words: "while".
▼
Vocabulary: Rephrase your introduction. Words match: 75%.
▼
Vocabulary: Replace the words computer with synonyms.
▼
Vocabulary: Rephrase the word "information" in your introduction.
▼
Vocabulary: The word "graph" was used 3 times.
▼
Vocabulary: The word "compared" was used 2 times.
▼
Vocabulary: The word "give" was used 2 times.
▼
Vocabulary: The word "information" was used 2 times.
▼
Vocabulary: The word "percentage" was used 2 times.
▼
Vocabulary: The word "increased" was used 2 times.
▼