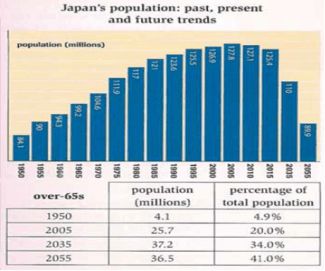
The chart below give information about population figures in Japan. Summarise the information by selecting and reporting the main features and make comparisons where relevant.

The bar chart gives information about the
amount
of the population
present in Japan
(over million
) since 1950 and Add an article
a million
give
Change the verb form
gives
prediction
for the future (in 2055). The table provides information about the Add an article
a prediction
amount
in
Change preposition
of
million
of Correct your spelling
millions
people
who are 65 years old or over and their rate in the population
total between 1950 and 2055
Looking at the bar chart, it is clear to see that the population
in Japan
has the least amount
of the population
comparing
to the other years. It hit a peak in 2005 and it is predicted that the Change the form of the verb
compared
number
of people
will drop under
a hundred Change preposition
to under
million
in 2055. According to
the diagram, in 1950 the quantity of eldest people
represent a small percentage of the population
. This
number
go up and will reach its maximum in 2035.
First of all, the bar chart shows that in 1950 the amount
of population
in
1950 was 84,1 Change preposition
apply
million
. It increased gradually until 2005 where
they reach a peak (127,8 Correct word choice
when
million
of
Change preposition
apply
people
in japan
). Change the capitalization
Japan
Then
the number
of Japanese start
to decrease slightly over 10 years. Wrong verb form
started
Moreover
, it is planned that in 2035 and 2055 the population
will fall down to 110 and 89,9 million
respectively.
On the other hand
, the number
of the eldest
Correct your spelling
oldest
people
in japan
was 4,1 million
in 1950 and represented 4,9% of the population
total. This
number
increased in 2005 with
25,7 Change preposition
to
million
(20% of the population
). Correct your spelling
Furthermore
Turthermore
, the diagram predict that in 2035 Correct your spelling
Furthermore
japanese
will hit a peak and will represent 40% of the Change the capitalization
Japanese
population
in 2055Submitted by ahmedlahouel5 on
Unauthorized use and/or duplication of this material without express and written permission from this site’s author and/or owner is strictly prohibited. Excerpts and links may be used, provided that full and clear credit is given to Writing9 with appropriate and specific direction to the original content.
Common mistake: Your writing should be 150-250 words.
Vocabulary: Rephrase your introduction. Words match: 71%.
▼
Vocabulary: Replace the words amount, population, japan, million, people, number with synonyms.
▼
Vocabulary: Rephrase the word "information" in your introduction.
▼
Vocabulary: The word "chart" was used 3 times.
▼
Vocabulary: The word "diagram" was used 2 times.
▼
Vocabulary: The word "gives" was used 2 times.
▼
Vocabulary: The word "represent" was used 3 times.
▼
Vocabulary: The word "amount" was used 4 times.
▼
Vocabulary: The word "information" was used 2 times.
▼
Vocabulary: The word "number of" was used 3 times.
▼
Vocabulary: The word "increased" was used 2 times.
▼
Vocabulary: The word "reach" was used 2 times.
▼
Vocabulary: The word "about" was used 2 times.
▼