The charts below show local government expenditure in 2010 and 2015. Summarise the information by selecting and reporting the main features, and make comparisons where relevant.

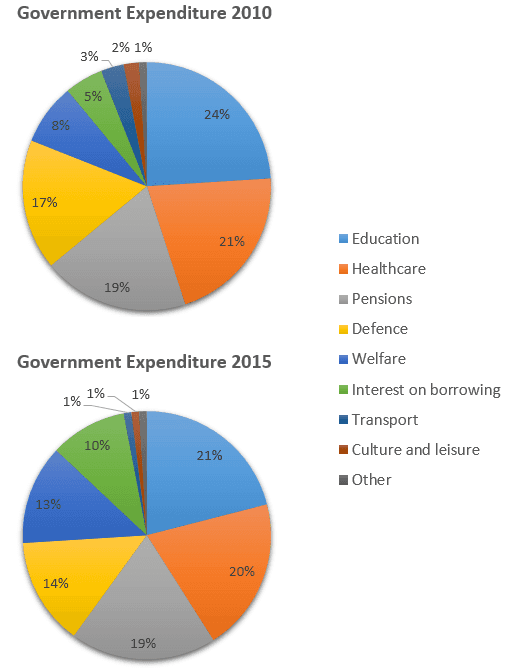
The percentage breakdown of
government’s
spending across nine categories in 2010 and 2015 is presented in the two pie charts below. Over the five-year period, the expenditures
witnessed significant changes.
The overall
picture indicates that, expenditures
in most areas
were cut by the government in order to fund the cost of borrowing and nation’s welfare needs.
In both years under analysis, the four largest categories of government expenditures
were: Education, Healthcare, Pensions and Defence, with Education making up the largest portion of 24% and 21% in 2010 and 2015, respectively. On the contrary
, the smallest areas
of spending were: Transport, Culture and Leisure and Other expenditures
. Spending on Welfare and Interest on borrowings laid in between.
It is interestingly seen that, between 2010 and 2015, except for Pensions; which remained the same at 19%, the government’s
spending on the four largest areas
had dropped. It is also
readily apparent that, the smallest areas
of government’s
spending, namely; Transport and Culture and Leisure also
witnessed a vital decrease with the Transport budget declining by two thirds. On the other hand
, spending on Welfare and Interest on government’s
borrowing rose dramatically, with the latter doubling over the five-year period to 10%.Submitted by baykalmeliksah on
Unauthorized use and/or duplication of this material without express and written permission from this site’s author and/or owner is strictly prohibited. Excerpts and links may be used, provided that full and clear credit is given to Writing9 with appropriate and specific direction to the original content.
Linking words: Don't use the same linking words: "also".
▼
Introduction: The introduction is missing.
▼
Introduction: The chart intro is missing.
▼
Introduction: The chart intro is missing.
▼
Vocabulary: Replace the words government’s, expenditures, areas with synonyms.
▼
Vocabulary: The word "go" was used 6 times.
▼
Vocabulary: The word "go" was used 6 times.
▼