The bar chart below shows the average Australian water consumption in selected cities for last year. The pie chart shows the distribution of Australian water consumption for last year. Summarise the information by selecting and reporting the main features, and make comparisons where relevant.

#bar #australian #water #consumption #cities #year #distribution #summarise #information #features #comparisons
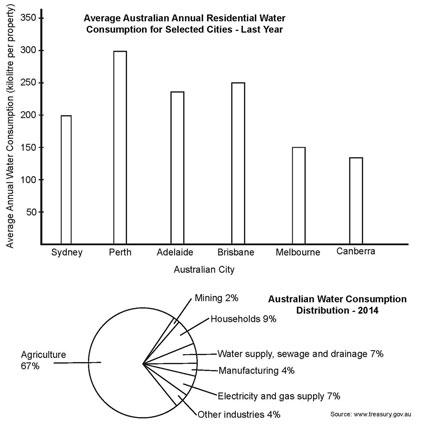
The given charts illustrate information about the consumption of
the
Correct article usage
apply
water
in different cities in Australia and the exact amount
of water
used in various industries which had taken a place last
year. It can be clearly seen from the first chart the highest amount
of water
has been used in Perth city while
the second
graph showed the
Agriculture contributed the largest portion of the figure.
Correct your spelling
that
According to
what is shown both Melbourne and Canberra had approximately the same amount
of water
used around 150 and 120 kilolitres per property, respectively, while
the
Adelaide city used Correct article usage
apply
less
amounts of Change the quantifier
fewer
water
than Brisbane, which were
about 220 and 250. The highest figures Correct subject-verb agreement
was
of
Change preposition
for
water
consumption were in Perth.
On the other hand
, the most reason for using that amount
of water
was agriculture, which was exactly 67%, while
the least reason of
Change preposition
for
water
consumption was mining 2%. Both water
supply and electricity had the same percentage 7% and 4% were in manufacturing and other industries.Unauthorized use and/or duplication of this material without express and written permission from this site’s author and/or owner is strictly prohibited. Excerpts and links may be used, provided that full and clear credit is given to Writing9 with appropriate and specific direction to the original content.
Linking words: Don't use the same linking words: "while".
▼
Vocabulary: Replace the words water, amount with synonyms.
▼
Vocabulary: Rephrase the word "information" in your introduction.
▼
Vocabulary: The word "charts" was used 2 times.
▼
Vocabulary: The word "figure" was used 2 times.
▼
Vocabulary: The word "amount" was used 5 times.
▼
Vocabulary: The word "about" was used 2 times.
▼