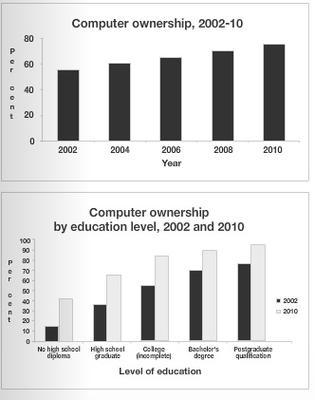
Academic Writing Take a look at the graphs and complete the task below. Task 1 The graphs above give information about computer ownership as a percentage of the population between 2002 and 2010, and by level of education for the years 2002 and 2010. Summarise the information by selecting and reporting the main features, and make comparisons where relevant. Write at least 150 words.

#look #graphs #information #computer #ownership #percentage #population #level #education #years #summarise #features #comparisons
By examining the graphs
which
they tell us about Correct pronoun usage
apply
computer
ownership as a percentage of the population between 2002 and 2010, we can somehow understand the relationship between computer
ownership and the educational level.
First of all, from the year 2002 to 2010, the percentage of how many people owning a computer
was gradually rising. It had been on the rise since 2002, from about 58% to 75%, to be exact.
Secondly
, the higher a person's education level, the higher the likelihood that he will have a computer
. Furthermore
, more and more people attend school in 2010 than those in 2002.
To sum up
, the two graphs above clearly show how computer
ownership is relevant to the education level in 2002 and 2010.Unauthorized use and/or duplication of this material without express and written permission from this site’s author and/or owner is strictly prohibited. Excerpts and links may be used, provided that full and clear credit is given to Writing9 with appropriate and specific direction to the original content.
Sentences: Add more complex sentences.
▼
Introduction: The introduction is missing.
▼
Introduction: Change the first sentence in the introduction.
▼
Introduction: The chart intro is missing.
▼
Common mistake: Your writing should be 150-250 words.
Basic structure: Change the third paragraph.
▼
Introduction: The chart intro is missing.
▼
Vocabulary: Replace the words computer with synonyms.
▼
Vocabulary: Only 6 basic words for charts were used.
▼
Vocabulary: The word "graphs" was used 2 times.
▼
Vocabulary: The word "percentage" was used 2 times.
▼
Vocabulary: The word "about" was used 2 times.
▼
Vocabulary: Use several vocabularies to present the data in the third paragraph.
▼