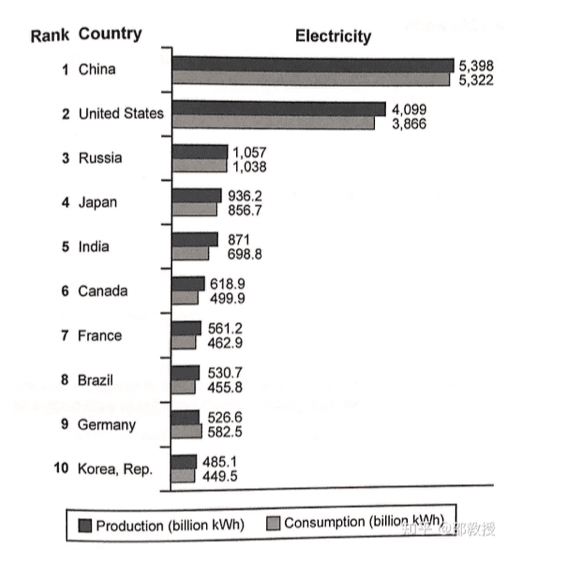
The bar chart below shows the top ten countries for the production and consumption of electricity in 2014. Summarise the information by selecting and reporting the main features, and make comparisons where relevant.

#bar #ten #countries #production #consumption #electricity #summarise #information #features #comparisons
The chart reveals the
electricity
production
and consumption
in top
ten leading countries in 2014.
In general, the amount of Correct article usage
the top
electricity
generated and used in China and the United States was far higher than that in other countries. It was also
noticeable that Germany was the only country that consumed more electricity
than it produced.
As can be seen from the chart, China had by far the greatest amount of electricity
production
at 5,398 billion
kWh
and consumption
at 5,322 billion
kWh
. It was followed by the United States with 4,099 billion
kWh
in production
and 3,866 billion
kWh
in consumption
. By contrast
, Korea only produced 485.1 billion
kWh
and used 449.5 billion
kWh
, which was the smallest figures
Fix the agreement mistake
figure
of
the ranking.
Meanwhile, Russia recorded mostly equal amount of Change preposition
in
electricity
production
and consumption
, which was just over 1,000 billion
kWh
. Japan produced and used more electricity
than India, but their figures did not exceed 1,000 billion
kWh
.
Looking at the other countries, their electricity
production
and consumption
ranged from over 450 billion
kWh
to over 600 billion
kWh
. It was interesting to note that Germany generaged
526.6 Correct your spelling
generated
billion
kWh
but used 582.5 billion
kWh
.Unauthorized use and/or duplication of this material without express and written permission from this site’s author and/or owner is strictly prohibited. Excerpts and links may be used, provided that full and clear credit is given to Writing9 with appropriate and specific direction to the original content.
Introduction: The introduction is missing.
▼
Introduction: Change the first sentence in the introduction.
▼
Introduction: The chart intro is missing.
▼
Basic structure: Change the fifth paragraph.
▼
Introduction: The chart intro is missing.
▼
Vocabulary: Rephrase your introduction. Words match: 71%.
▼
Vocabulary: Replace the words electricity, production, consumption, billion, kwh with synonyms.
▼
Vocabulary: Only 4 basic words for charts were used.
▼
Vocabulary: The word "chart" was used 2 times.
▼
Vocabulary: The word "figures" was used 2 times.
▼
Vocabulary: The word "amount" was used 3 times.
▼
Vocabulary: Use several vocabularies to present the data in the fifth paragraph.
▼