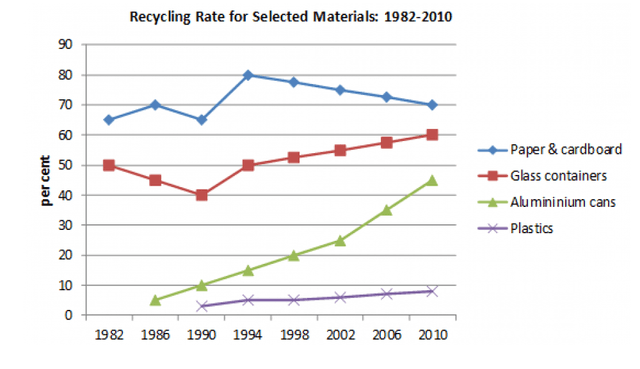
The graph below shows the proportion of four different materials that were recycled from 1982 to 2010 in a particular country. Sumarise the information by selecting and reporting the main eatures, and make comparisons where relevant.

The graph elucidates the segment of four different materials from the 1982 to 2010 period in
a
several Correct article usage
apply
country
.
In 1982,only 0% of Change to a plural noun
countries
aluminium
Add an article
the aluminium
can
were recycled. Correct subject-verb agreement
cans
Thus
, in 2010 this
rate
reache
a peak of 45% and Correct your spelling
reached
reaches
reach
similarly
, only 0% of plastic recycling in 1982 instead
of there is littel
increased Correct your spelling
little
into
9% in 2010.
Change preposition
to
Besides
, paper and carboard
have Correct your spelling
cardboard
highest
Change the article
the highest
rate
in 1982. It have
Change the verb form
has
62
% Correct article usage
a 62
rate
and in 2010 it grew into
70%.
The Change preposition
to
last
, glass containers are the second
higher in 1982 with the
50% percentage and raise Correct article usage
apply
into
60% in 2010.
To recapitulate, aluminium cans grow Change preposition
to
than
Correct quantifier usage
more than
the
others Correct article usage
apply
have
Change preposition
at have
stagnant
Correct article usage
a stagnant
rate
.Unauthorized use and/or duplication of this material without express and written permission from this site’s author and/or owner is strictly prohibited. Excerpts and links may be used, provided that full and clear credit is given to Writing9 with appropriate and specific direction to the original content.
Introduction: The introduction is missing.
▼
Introduction: Change the first sentence in the introduction.
▼
Introduction: The chart intro is missing.
▼
Common mistake: Your writing should be 150-250 words.
Basic structure: Change the third paragraph.
▼
Basic structure: Change the fifth paragraph.
▼
Introduction: The chart intro is missing.
▼
Vocabulary: Replace the words rate with synonyms.
▼
Vocabulary: Only 3 basic words for charts were used.
▼
Vocabulary: Use several vocabularies to present the data in the third paragraph.
▼
Vocabulary: Use several vocabularies to present the data in the fifth paragraph.
▼