The bar graph below shows the amount of carbon emissions in different countries during three different years. Summarise the information by selecting and reporting the main features, and make comparisons where relevant.

#bar #amount #carbon #emissions #countries #three #years #summarise #information #features #comparisons
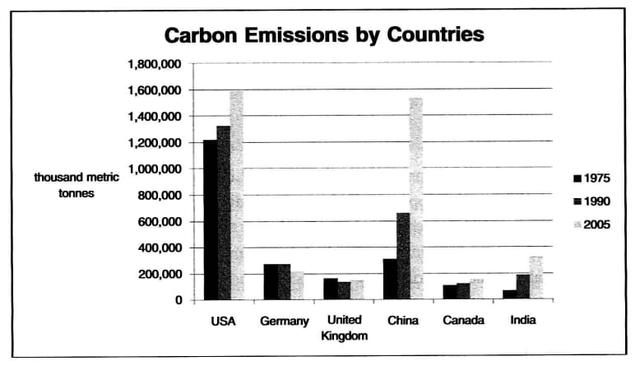
The graph gives information about the
carbon
footprint produced by various countries in 1975,1990,and 2005.In addition
, the amount Of carbon
emission were
measured in thousand metric tonnes.
Change the verb form
was
Overall
,the USA and china
Change the capitalization
China
had
produced Unnecessary verb
apply
largest
amount of Add an article
the largest
carbon
during all three years
As can seen
from the graph, Change the verb form
see
be seen
that
Correct determiner usage
the
USA
emitted Correct article usage
the USA
greater
amount of Correct article usage
a greater
carbon
, showing increase
from slightly above Add an article
an increase
the
1,20,000 in 1975 and 1990 to 1,60,000 in 2005 Correct article usage
apply
while
, china Correct your spelling
produced
producrd
nearly 300,000 in 1975 ,two folds above 60,000 in 19990 and Correct your spelling
produced
Correct your spelling
slightly
slighlty
less than 1,60,000 in 2005Correct your spelling
slightly
Unauthorized use and/or duplication of this material without express and written permission from this site’s author and/or owner is strictly prohibited. Excerpts and links may be used, provided that full and clear credit is given to Writing9 with appropriate and specific direction to the original content.
Common mistake: Your writing should be 150-250 words.
Vocabulary: Replace the words carbon with synonyms.
▼
Vocabulary: The word "graph" was used 2 times.
▼
Vocabulary: The word "amount" was used 3 times.
▼