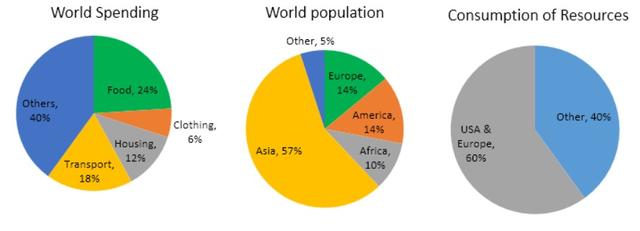
The pie charts below give data on the spending and consumption of resources by countries of the world and how the population is distributed.

The pie chart illustrates the way spending and consumption of resources by nations of the
world
and population
distribution. Units measured in percentage.
Overall
, the world
spending is majorly on other expenditures with exactly 40%. The world
population
, however
, is predominantly Asia with 57%. The resources are mostly consumed by USA and Europe with 60%.
The highest purchases made by the world
population
is
others at 40%, food is another major expense with 24%. Correct subject-verb agreement
are
Moreover
, transportation and housing came in closely
at 18% and 12% respectively. With very few people buying clothing.
Change the word
close
In contrast
, to the large Asian population
, Africa has the lowest amount of people in the world
with only 10%. Leaving Europe and America in the middle with equal
Add an article
an equal
the equal
amount
at 14%. USA and Europe are the main nations who consume the resources the most in the Fix the agreement mistake
amounts
world
, while
other unnamed nations used up the remaining 40%.Submitted by kumrash2019 on
Unauthorized use and/or duplication of this material without express and written permission from this site’s author and/or owner is strictly prohibited. Excerpts and links may be used, provided that full and clear credit is given to Writing9 with appropriate and specific direction to the original content.
Sentences: Add more complex sentences.
▼
Common mistake: Your writing should be 150-250 words.
Basic structure: Change the third paragraph.
▼
Vocabulary: Replace the words world, population with synonyms.
▼
Vocabulary: Only 4 basic words for charts were used.
▼
Vocabulary: The word "amount" was used 2 times.
▼
Vocabulary: Use several vocabularies to present the data in the second paragraph.
▼
Vocabulary: Use several vocabularies to present the data in the third paragraph.
▼