The give graph shows the consumption of fast food in UK (per week) from 1970 to 1990. Write a report for a university lecturer making comparisons where relevant and reporting the main features.

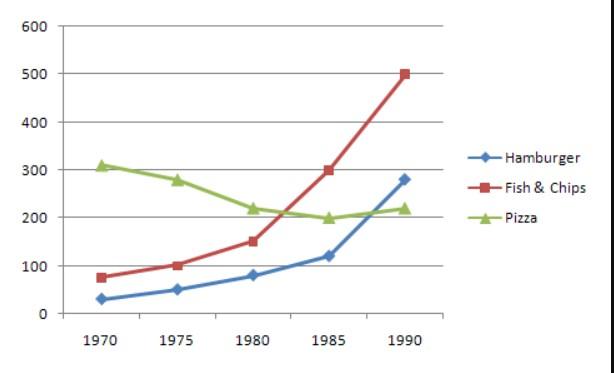
The line graph provides information about the quality of three different kinds of fast food consumed in the United Kingdom over a twenty-year period between 1970 and 1990.
Overall
, it is clear that
the consumption
of hamburger
, Fix the agreement mistake
hamburgers
fish
and chips
experienced upward
trend during the research period. Correct article usage
an upward
In addition
, the amount
of pizza
that people consumed declined considerably.
In 1970, there was a steadiness in the amount
of pizza
, on average, people consumed 300 grams
; compared to approximated
60 Replace the word
approximately
grams
for fish
and chips
, 40
Correct word choice
and 40
grams
for Add an article
a hamburger
the hamburger
hamburger
. Between 1970 and 1980, there was a dramatic slump in the quality of Fix the agreement mistake
hamburgers
pizza
by 90 grams
. While
the figure for hamburger
, Fix the agreement mistake
hamburgers
fish
and chips
continued to increase to 80 grams
and 150 grams
respectively. Furthermore
, end of 1980, the consumption
of pizza
, fish
and chips
were
at the same Correct subject-verb agreement
was
210
Change preposition
at 210
grams
.
In 1985, the consumption
of fish
and chips
climbed quickly to 300 grams
. Additionally
, end of 1985, the amount
of pizza
and hamburger
were
Unnecessary verb
apply
both
consumed at 210 Correct pronoun usage
apply
grams
. From 1985 to 1990, the quality of fish
and chips
jumped sharply to 500 and become the highest figure during the research period. At the same time, there was a dramatic significantly
in the Change the word
significant
amount
of hamburger
that people consumed from 120 Fix the agreement mistake
hamburgers
grams
to 280 grams
. Moreover
, there was a slight growth in the consumption
of pizza
, with a rise of over 10 grams
in just 5 years from 1985 to 1990.Submitted by nguyennhancrazy on
Unauthorized use and/or duplication of this material without express and written permission from this site’s author and/or owner is strictly prohibited. Excerpts and links may be used, provided that full and clear credit is given to Writing9 with appropriate and specific direction to the original content.
Sentences: Add more complex sentences.
▼
Vocabulary: Replace the words consumption, hamburger, fish, chips, amount, pizza, grams with synonyms.
▼
Vocabulary: The word "figure" was used 2 times.
▼
Vocabulary: The word "amount" was used 4 times.
▼
Vocabulary: The word "dramatic" was used 2 times.
▼