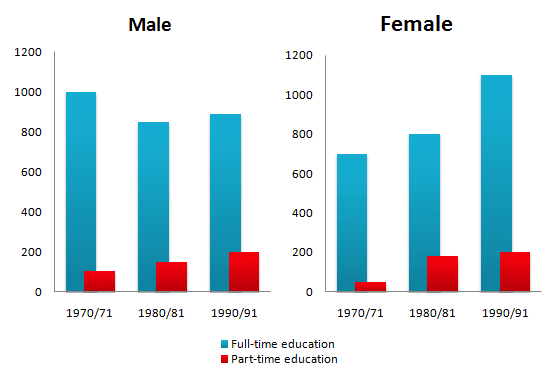
The chart below shows the number of men and women in further education in Britain in three periods and whether they were studying full-time or part-time. Summarise the information by selecting and reporting the main features, and make comparisons where relevant.

The chart demonstrates the people
count
who was
pursuing higher Correct subject-verb agreement
were
education
in Britain every decade from 1970 to 1990, split by course type and gender.
The trend for the number of men in full-time education
is slightly fluctuating between 800 and 1000. It was reduced to around 850 in 1990/81 from their starting count
of 1000 in 1970/71. Then
, it rose to 900 in 1990/91. By contrast
, the count
for
men in part-time Change preposition
of
education
steadily increased from roughly 100 in 1970/71 to a peak of over 200 at the end
of the third
decade.
Turning to women
's education
, the number of women
in full-time education
consistently increased from 800 in 1970/71 to over 1000 which is nearly more than half of its initial count
in 1990/91. Similarly
, The part-time education
count
also
reflects the same pattern as that of full-time education
. Starting with a count
of just around 100 to 200 towards the end.
In Summary, part-time education
gained popularity among men and women
over the decades. However
, the majority of people taking full-time education
in the later period of the decade are women
.Unauthorized use and/or duplication of this material without express and written permission from this site’s author and/or owner is strictly prohibited. Excerpts and links may be used, provided that full and clear credit is given to Writing9 with appropriate and specific direction to the original content.
Introduction: The introduction is missing.
▼
Introduction: Change the first sentence in the introduction.
▼
Introduction: The chart intro is missing.
▼
Basic structure: Change the fourth paragraph.
▼
Introduction: The chart intro is missing.
▼
Vocabulary: Replace the words count, education, women with synonyms.
▼
Vocabulary: The word "number of" was used 2 times.
▼
Vocabulary: The word "increased" was used 2 times.
▼
Vocabulary: The word "around" was used 2 times.
▼
Vocabulary: Use several vocabularies to present the data in the fourth paragraph.
▼