The given pie charts compare the expenses in 7 different categories in 1966 and 1996 by American Citizens. Summarise the information by selecting and reporting the main features, and make comparisons where relevant.

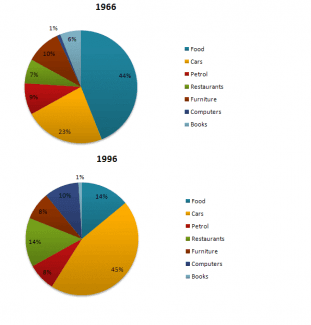
The provided pie-charts illustrate the comparison of the money spent in seven different sectors by the native Americans, over a period of thirty years I.
e
. From 1966 onwards.
Overall
, the
food used to be the major Correct article usage
apply
expense
of the
American citizens in 1966, but in 1999 it was replaced by Correct article usage
apply
the
cars. Four out of seven categories witnessed a fall in their expenditure, in Correct article usage
apply
contrary
a hike in money spent was noted in three things.
Add a comma
,contrary
To begin
with, in 1966, a major chunk of the total income had to be spent by the
Americans in lieu of food I.Correct article usage
apply
e
. 44%. Whereas
, after thirty years, this
expense
dropped to one-third
of its value I.e
. 14%.
On the other hand
, the cars which shared an expense
of 23% in year
1966 had considerably increased to double the figures in 1996 I.Change the article
the year
e
. 45%. The money spent on the
furniture and petrol dropped slightly from 9% and 10%, respectively, in 1966 to 8% each in 1999. Correct article usage
apply
This
fall was, however
, was
more conspicuous for the books which plunged to almost 1% in 1999 from 6% of the total Unnecessary verb
apply
expense
, thirty years back.
In contrast
, the costs on
Change preposition
of
the
restaurants and eatery doubled from 7% over Correct article usage
apply
this
time frame and the computers which incurred a cost of 1% in 1966 had now hiked to 10% in 1999.Submitted by yasirjaved2219 on
Unauthorized use and/or duplication of this material without express and written permission from this site’s author and/or owner is strictly prohibited. Excerpts and links may be used, provided that full and clear credit is given to Writing9 with appropriate and specific direction to the original content.
Introduction: The introduction is missing.
▼
Introduction: The chart intro is missing.
▼
Basic structure: Change the third paragraph.
▼
Basic structure: Change the fifth paragraph.
▼
Introduction: The chart intro is missing.
▼
Vocabulary: Replace the words e, expense with synonyms.
▼
Vocabulary: The word "fall" was used 2 times.
▼
Vocabulary: Use several vocabularies to present the data in the third paragraph.
▼
Vocabulary: Use several vocabularies to present the data in the fifth paragraph.
▼