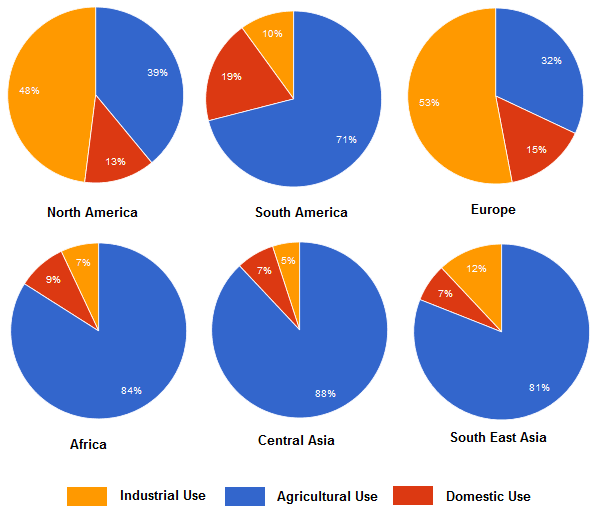
the pie charts below show the percentage of water used for different purposes in six areas of the world. Summarise the information by selecting and reporting the main features, and make comparisons where relevant.

#show #percentage #water #purposes #six #areas #world #summarise #information #features #comparisons
The provided pie charts
illustrates
the utilization of water in six nations for various reasons.
As can be seen from the pie graphs, Change the verb form
illustrate
the
water consumption in both North America and Europe share a similar composition. To be more specific, in both continents, about Correct article usage
apply
a
half amount of the water is required in industrial sectors, nearly one-Correct article usage
apply
third
is spent on cultivating crops, and only 13% to 15% for people’s family use.Submitted by gs.gala15 on
Unauthorized use and/or duplication of this material without express and written permission from this site’s author and/or owner is strictly prohibited. Excerpts and links may be used, provided that full and clear credit is given to Writing9 with appropriate and specific direction to the original content.
Linking words: Add more linking words.
▼
Basic structure: Write more paragraphs.
▼
Basic structure: Add more body paragraphs.
▼
Common mistake: Your writing should be 150-250 words.
Basic structure: Write more paragraphs.
▼