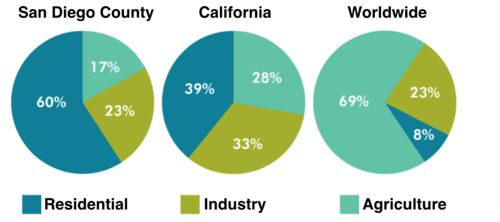
The pie chart below compare water usage in San Diego, California, Worldwide

The given pie charts show a comparison of
water
consumptions
in domestic, industrial and agricultural sectors in Fix the agreement mistake
consumption
San
Diego
, California
and the world as a whole.
Overall
, in the two American regions
the majority of Add a comma
,regions
water
was used for homes followed by industry and agriculture Add an article
the water
while
worldwide use focused overwhelmingly on agriculture over industry and finally
residential use.
In San
Diego
County, residential water
consumption accounts for 60%, which is around 20% higher than that of California
. By contrast
, the global residential water
usage is only 8% for the same purpose in other parts of the world, which is the lowest figure in the chart. It is remarkable that San
Diego
and the world used the same rate of water
at 23% for industry while
the figure for California
was 10% higher at 33%.
Global water
consumption for farming is approximately 70%, which is significantly higher than the use of water
in San
Diego
and California
for the same purpose. Only 17% and 28% water
is used for cultivation in Change preposition
of water
San
Diego
and California
respectively.Unauthorized use and/or duplication of this material without express and written permission from this site’s author and/or owner is strictly prohibited. Excerpts and links may be used, provided that full and clear credit is given to Writing9 with appropriate and specific direction to the original content.
Linking words: Don't use the same linking words: "while".
▼
Vocabulary: Replace the words water, san, diego, california with synonyms.
▼
Vocabulary: The word "charts" was used 2 times.
▼
Vocabulary: The word "figure" was used 2 times.
▼
Vocabulary: Use several vocabularies to present the data in the second paragraph.
▼