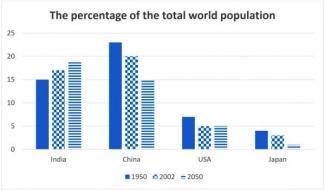
The bar chart shows the percentage of total world population in 4 countries in 1950 and 2003, and projections for 2050.

The bar chart compares
overall
global Correct article usage
the overall
population
,who live in four various countries namely:India
,China
,Usa
and Correct your spelling
USA
Japan
) from 1950 to 2003 including calculation to 2050.
Overall
,It is obviously clear,that India
and China
have the highest percentage
of population
over the period shown,Add an article
the population
while
the lowest percentage
of total
Add an article
the total
population
consisted in Usa
and Correct your spelling
USA
Japan
.
In 1950,China
consisted a majority percentage
of people over 20,which was a peak and going to the
2050 the amount of total Change the article
apply
population
decreased to exactly 15,as opposed,was in India
in 1950. By contrast
with population
of Correct article usage
the population
China
,from 2002 to 2050 India
demonstrate an increasing
in the number of society about 16 and 18 respectively .
In terms of Replace the word
increase
USA
and Correct article usage
the USA
Japan
,at the beginning of the year,an
approximately 7 Correct article usage
apply
percentage
of peopleReplace the word
per cent
was
depicted by Change the verb form
were
USA
compared with Correct article usage
the USA
Japan
,it
was under 5 Correct pronoun usage
which
percentage
of Replace the word
percent
total
global Add an article
the total
population
.The exactly
5 Correct article usage
Exactly
percentage
of Replace the word
per cent
total
society resided in Correct article usage
the total
USA
Correct article usage
the USA
in
2002 and 2050 years.Change preposition
between
By contrast
,Japan
accounted for a negligible amount of total
global Correct article usage
the total
population
.Unauthorized use and/or duplication of this material without express and written permission from this site’s author and/or owner is strictly prohibited. Excerpts and links may be used, provided that full and clear credit is given to Writing9 with appropriate and specific direction to the original content.
Linking words: Don't use the same linking words: "by contrast, overall".
▼
Vocabulary: Replace the words population, india, china, usa, japan, percentage with synonyms.
▼
Vocabulary: The word "compares" was used 2 times.
▼
Vocabulary: The word "amount" was used 2 times.
▼
Vocabulary: The word "percentage" was used 6 times.
▼