The charts below give information on transport and car use in Edmonton.

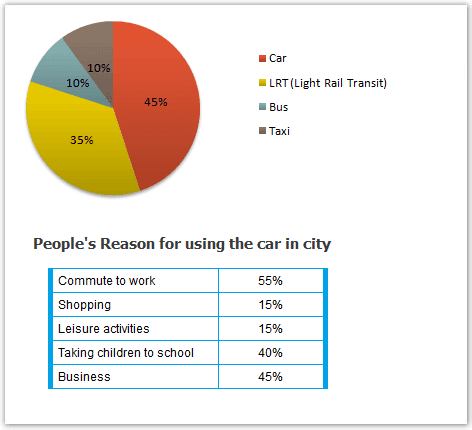
The pie chart compares the use of four different means of transport in Edmonton, and the table illustrates the reasons for driving a
car
inside the city.
Overall
, cars are by far the most popular mode of travel, and the most common explanation for using this
type of vehicle is to commute to work at the time surveyed.
It is noticeable from the pie chart that most of the transport in Edmonton is done by car
and by Light Rail Transit. In particular
, the former accounts for 45% of the city transportation, while
the latter is used by 35% of travellers. Meanwhile, buses and taxis share the same figure of
passengers, with 10% each.
Regarding the reasons for using the Change preposition
for
car
, more than half (55%) drive their car
to work, followed by 45% for business purposes. Ranked third
is the figure for those taking their children to school, recorded at 40%. However
, this
type of vehicle is least used for going shopping and engaging in leisure activities, with just 15% in each category.Submitted by truonghong20102002 on
Unauthorized use and/or duplication of this material without express and written permission from this site’s author and/or owner is strictly prohibited. Excerpts and links may be used, provided that full and clear credit is given to Writing9 with appropriate and specific direction to the original content.
Vocabulary: Replace the words car with synonyms.
▼
Vocabulary: The word "chart" was used 2 times.
▼
Vocabulary: The word "figure" was used 2 times.
▼
Vocabulary: Use several vocabularies to present the data in the second paragraph.
▼