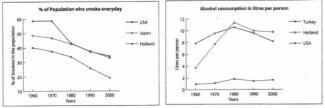
The two graphs below show the percentage of smokers and the consumption of alcohol in litres in selected countries for the period 1960-2000. Write a report for a lecturer describing the information in the graphs.

#two #graphs #show #percentage #smokers #consumption #alcohol #litres #countries #period #report #lecturer #information
The given two-line graph
illustrate
Change the verb form
illustrates
the
information about the terms of proportion of smoking and Correct article usage
apply
alcohol
in litres which
taken by people daily in four various regions Correct pronoun usage
apply
such
as USA
, Japan, Correct article usage
the USA
Holland
and Turkey in four decades during
1960 and 2000.
Change preposition
apply
In
Change preposition
Overall
overall
, Holland
constituted a major for smokers and alcohol
drinkers whilst least
amount of both items were consumed by American and Turkish. Correct article usage
the least
However
, there were lots of transformation
Fix the agreement mistake
transformations
can
be noticed in the Correct pronoun usage
that can
amount
of people who smoke and drink regularly in all the nations over the periods.
With regards to an initial chart, between 1960 and 1980, the Change the quantifier
number
Holland
natives was
most popular for smoking every day which accounted Change the verb form
were
from
nearly three-fifths to above Change preposition
for
twofifths
followed by Japan (approximately a half). Correct your spelling
two-fifths
two fifths
After
this
, in the upcoming 2 decades, the percentage of humans who smoke daily was
started Unnecessary verb
apply
decreased
dramatically Change the verb form
to decrease
at
over 30% in Change preposition
to
the
both countries. Remove the article
apply
Likewise
, The
America accounted for 40% Correct article usage
apply
for
regular smokers during 1960 and experienced a little less than Change preposition
of
two- fold
Add a hyphen
two-fold
declined
to approximately a fifth Replace the word
decline
in
the end of the period.
The Change the preposition
at
second
graph proves that an
amount of Correct article usage
the
Holland
and USA
Correct article usage
the USA
for
drinking Change preposition
apply
alcohol
in litres were
found 11%, 10%, 9%, 8% and 4% respectively between 1980, 1970 and 1960. Correct subject-verb agreement
was
In contrast
, the two given regions were showing ups and downs figure
and following in zig zag trends in the remaining twenty years. Correct subject-verb agreement
figures
Lastly
, alcohol
consumption in litres per person for Turkey remained relatively constant at 2% in all given yearsUnauthorized use and/or duplication of this material without express and written permission from this site’s author and/or owner is strictly prohibited. Excerpts and links may be used, provided that full and clear credit is given to Writing9 with appropriate and specific direction to the original content.
Conclusion: The conclusion is too long.
Vocabulary: Replace the words alcohol, holland with synonyms.
▼
Vocabulary: The word "graph" was used 2 times.
▼
Vocabulary: The word "give" was used 3 times.
▼
Vocabulary: The word "amount" was used 3 times.
▼
Vocabulary: The word "approximately" was used 2 times.
▼