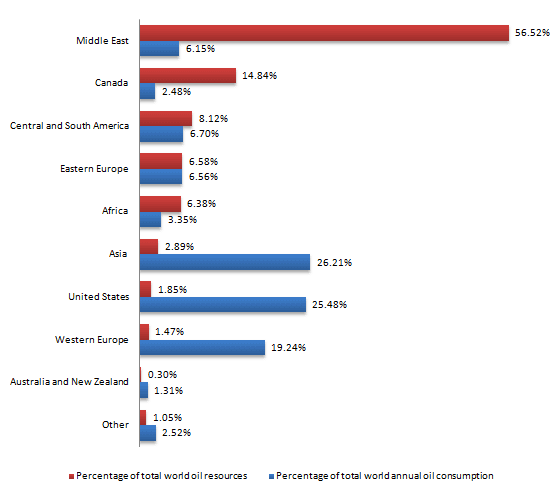
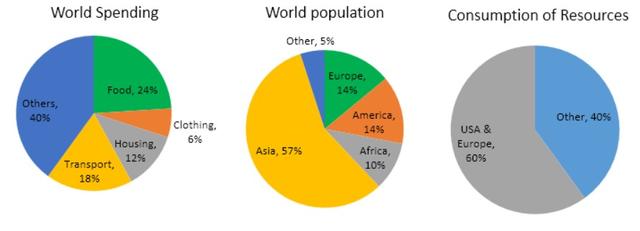
The pie charts below give data on the spending and consumption of resources by countries of the world and how the population is distributed.

The following graphs present how many resources the
world
population
intake and what are they spending their national budget for.
It is clear from illustrations that the
three fifth of resources are consumed by the USA and Europe, despite the fact that their Correct article usage
a
population
accounts for only 14% for
each of them.
Now turning to the details, just under a quarter (24%) of Change preposition
of
world
spending is directed to providing food, however
the majority (40%) of Add a comma
,however
world
spending comprises other unknown categories. It can be seen from the charts that transport expenses make up 18%, while
housing expenses account for only 12%. The countries spend only 6% of their budget on clothing.
It is worth mentioning that just over a
half of Correct article usage
apply
Correct article usage
the world
world
Change noun form
world's
population
accounts for Asians, whereas
African people make up 10% and 5% comprises the other population
of the world
.
Overall
, the
most part of Correct article usage
apply
budget
of Add an article
the budget
world
countries is spent for
some needs, except transport, food, housing and clothing.Change preposition
on
Submitted by 2walk.kg on
Unauthorized use and/or duplication of this material without express and written permission from this site’s author and/or owner is strictly prohibited. Excerpts and links may be used, provided that full and clear credit is given to Writing9 with appropriate and specific direction to the original content.
Vocabulary: Replace the words world, population with synonyms.
▼
Vocabulary: Only 5 basic words for charts were used.
▼
Vocabulary: Use several vocabularies to present the data in the second paragraph.
▼
Vocabulary: Use several vocabularies to present the data in the fifth paragraph.
▼