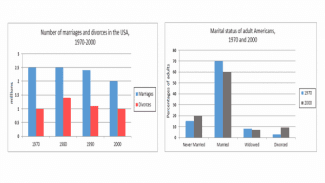
The charts below give information about USA marriage and divorce rates between 1970 and 2000 and the marital status of adult Americans in two of the years. Summarize the information by selecting and reporting the main features, and make comparisons where relevant.

#information #usa #marriage #divorce #rates #status #adult #americans #two #years #features #comparisons
The 1st
bar
chart illustrates the figure of
Change preposition
for
marriages
and the percentage of divorce in the year 1970 to 2000. The 2nd bar
sketch demonstrates the marital status of adults in the years 1970 and 2000.
According to
the first bar
chart, there was a downward trend in the number of marriages
and rates of divorces. The highest separation percentage and most numbers of marriages
have shown respectively at about 1.4 million and 2.5 million in 1980. However
, the highest figure of
Change preposition
for
marriages
has also
shown in 1970 and after that, it decreases over the period. The lowest amount of marriages
has shown at about 2 million in the year 2000 while
the separation ratio is decreasing this
year.
On the flip side, from
the 2nd Change preposition
apply
bar
graph is divided into 4 distinct categories – never categories, married, widowed and divorced in between 1970 and 2000. The marital status of adult Americans in 1970 is that 60 percent
of an adult is married Change the spelling
per cent
and
remains the greatest of all groups. Correct word choice
apply
On the other hand
, the amount of marriage
decreases Fix the agreement mistake
marriages
at
about 11 Change preposition
by
percent
in 2000. Change the spelling
per cent
However
, the amount
of widowed Change the quantifier
number
decreases
as compared to 2000. The figure Wrong verb form
decreased
of
unmarried adults is 12 Change preposition
for
percent
in 1970 Change the spelling
per cent
while
it goes up in 2000 Correct word choice
apply
while
the separation percentage is increasing in 2000 as compared to 1970.Unauthorized use and/or duplication of this material without express and written permission from this site’s author and/or owner is strictly prohibited. Excerpts and links may be used, provided that full and clear credit is given to Writing9 with appropriate and specific direction to the original content.
Linking words: Don't use the same linking words: "however, while".
▼
Vocabulary: Replace the words bar, marriages with synonyms.
▼
Vocabulary: The word "chart" was used 2 times.
▼
Vocabulary: The word "compared" was used 2 times.
▼
Vocabulary: The word "figure" was used 3 times.
▼
Vocabulary: The word "amount" was used 3 times.
▼
Vocabulary: The word "number of" was used 2 times.
▼
Vocabulary: The word "percentage" was used 3 times.
▼
Vocabulary: The word "decreases" was used 3 times.
▼
Vocabulary: The word "about" was used 3 times.
▼