The diagram below shows how the Australian Bureau of Meteorology collects up-to-the-minute information on the weather in order to produce reliable forecasts. Write a report for a university lecturer describing the information shown below.

#australian #bureau #meteorology #up-to-the-minute #information #weather #forecasts #report #university #lecturer
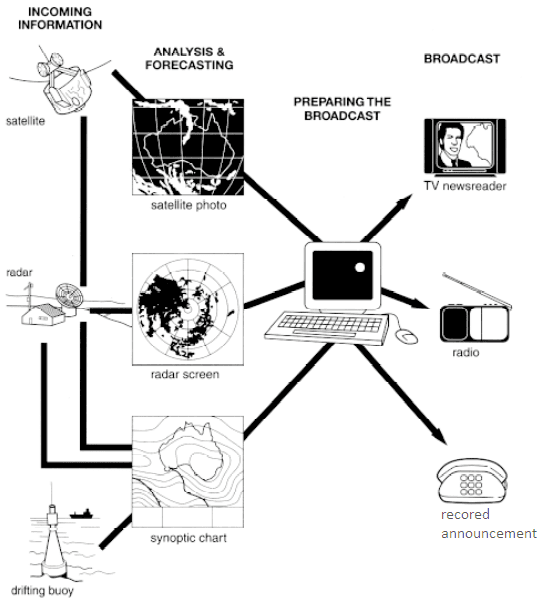
The given flow chart shows the process that the Australian Bureau of Meteorology follows to assemble weather
information
via such
ways as satellite
, Fix the agreement mistake
satellites
radar
and drifting buoys
to provide reliable weather forecast
to the public.
It can be clearly seen that the process of collecting Fix the agreement mistake
forecasts
information
demands different steps. Satellite
, radar
and drifting buoys
are the most popular and frequently used tools for collecting data to prepare the forecast
.
According to
the chart, the Australian Bureau of Meteorology relies on satellites, radars and drifting buoys
to collect initial data. For satellite
, the Fix the agreement mistake
satellites
information
turns into satellite
photos, which are analyzed by bureau specialists. The information
from radar
transforms into the Correct article usage
the radar
radar
screen, and one from buoys
turns into the synoptic chart. After collecting data, specialists Correct article usage
the buoys
then
analyze it on computer devices. In this
stage, the forecast
is prepared to be broadcast to the mass people. The prepared forecast
on weather is then
sent to television, radio and recording devices for the citizens all around the country.Submitted by AYUSHI on
Unauthorized use and/or duplication of this material without express and written permission from this site’s author and/or owner is strictly prohibited. Excerpts and links may be used, provided that full and clear credit is given to Writing9 with appropriate and specific direction to the original content.
Vocabulary: Replace the words information, satellite, radar, buoys, forecast with synonyms.
▼
Vocabulary: Rephrase the word "information" in your introduction.
▼
Vocabulary: The word "chart" was used 3 times.
▼
Vocabulary: The word "data" was used 3 times.
▼
Vocabulary: The word "information" was used 4 times.
▼