The table below shows CO2 emissions for different forms of transport in the European Union. The Pie Chart shows the percentage of European Union funds being spent on different forms of transport. Write a report for a university lecturer describing the information shown below.

#co #emissions #forms #transport #european #union #percentage #funds #report #university #lecturer #information
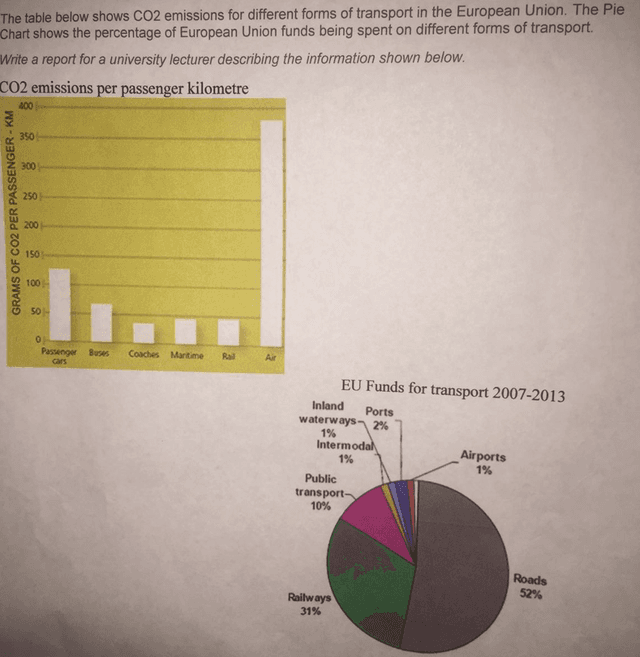
The two charts display the amount of carbon dioxide
emissions
for different modes of transport and the percentage of funds of the Europen Union that are being spent on various transportation modes.
We get a very clear picture from both the
figures. We get to know that passenger cars are the main cause of CO2 Correct article usage
apply
emissions
per passenger kilometre and the Europen
Union spent more than half of its funds on road transportation between 2007 and 2013.
The bar graph shows that cars contribute to almost one hundred and Correct your spelling
European
twenty five
grams of CO2 emission per passenger kilometre Add a hyphen
twenty-five
emissions
. While
coaches are responsible for three quarters
of a century Add a hyphen
three-quarters
grams
of CO2 Change preposition
of grams
emissions
. Buses lie somewhere between the two mentioned forms of transport.
In the pie chart, the most clear
observation is that the European Union, from 2007 to 2013, spent a little more than half of its funds on road transportation. The EU Change the adjective
clearest
also
spent almost one
Add a hyphen
one-third
third
of it on railways, the
remaining 17% was spent on Correct word choice
and the
the
other modes of transport like inland waterways and ports. Airports contributed to only 1% of the entire budget of the EU in those six years.Correct article usage
apply
Submitted by wofiso7437 on
Unauthorized use and/or duplication of this material without express and written permission from this site’s author and/or owner is strictly prohibited. Excerpts and links may be used, provided that full and clear credit is given to Writing9 with appropriate and specific direction to the original content.
Introduction: The introduction is missing.
▼
Introduction: Change the first sentence in the introduction.
▼
Introduction: The chart intro is missing.
▼
Introduction: The chart intro is missing.
▼
Vocabulary: Replace the words emissions with synonyms.
▼
Vocabulary: The word "charts" was used 2 times.
▼
Vocabulary: The word "almost" was used 2 times.
▼