The table below shows the results of surveys in 2005, 2010 and 2015 about McGill University. Summarise the information by selecting and reporting the main features, and make comparisons where relevant.

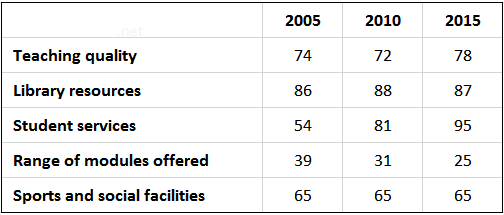
The table shows the change in attitude, over ten years, of students at McGill University to different aspects of its academic provision.
Overall
, the most striking set of statistics relates to approval for student services. There was a sharp increase in the number of students giving these services a good rating, particularly in the first five years: from 54 percent
in 2005Change the spelling
per cent
,
to 81 Remove the comma
apply
percent
in 2010, and 95 Change the spelling
per cent
percent
in 2015. There was Change the spelling
per cent
also
an overall
improvement in ratings for teaching quality, though the increase was relatively small (74 percent
in 2005 rising to 78 Change the spelling
per cent
percent
in 2015) and there was a decline in the interim (72 Change the spelling
per cent
percent
in 2010). There was Change the spelling
per cent
also
a fluctuation in attitudes to library resources, rising from 86 percent
to 88 Change the spelling
per cent
percent
in the first five years and Change the spelling
per cent
then
falling by one percent
in 2015. Good ratings for the university’s sports and social facilities were identical throughout, at 65 Change the spelling
per cent
percent
. Change the spelling
per cent
Finally
, there were poor ratings at the beginning of the period in the range of modules offered (39 percent
in 2005) and they got worse, falling steadily to 31 Change the spelling
per cent
percent
in 2010 and 25 Change the spelling
per cent
percent
in 2015.Change the spelling
per cent
Submitted by kwarts on
Unauthorized use and/or duplication of this material without express and written permission from this site’s author and/or owner is strictly prohibited. Excerpts and links may be used, provided that full and clear credit is given to Writing9 with appropriate and specific direction to the original content.
Sentences: Add more complex sentences.
▼
Linking words: Don't use the same linking words: "also, overall".
▼
Conclusion: The conclusion is too long.
Basic structure: Write more paragraphs.
▼
Basic structure: Add more body paragraphs.
▼
Basic structure: Write more paragraphs.
▼
Vocabulary: Replace the words percent with synonyms.
▼
Vocabulary: Rephrase the word "shows" in your introduction.
▼
Vocabulary: The word "fall" was used 2 times.
▼
Vocabulary: The word "go" was used 3 times.
▼
Vocabulary: The word "go" was used 3 times.
▼
Vocabulary: The word "increase" was used 2 times.
▼