The charts below show the changes in ownership of the electrical appliances and amount of time spent doing housework in households in one country between 1920 and 2019. Summarise the information by selecting and reporting the main features, and make comparisons where relevants

#show #changes #ownership #appliances #amount #time #housework #households #country #summarise #information #features #comparisons #relevants
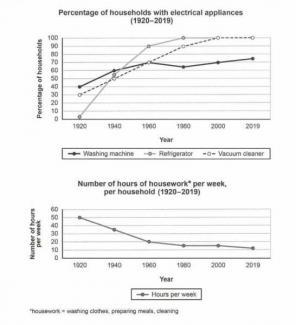
The data provide information on the percentage of households owning three kinds of electrical appliances, namely washing machines,
refrigerators
and vacuum cleaners, and how much time they spent on
carrying out Change preposition
apply
the
household chores in one country from 1920 to 2019.
Correct article usage
apply
Overall
, ownership of all these pieces of equipment increased; conversely
, the total time allocated for housework decreased significantly. The most salient feature of this
data is that refrigerators
became ubiquitous dramatically.
In the first year of the given time frame, washing machines were the most common of the three, with two-fifths of households having them. the only downward trend can be seen in this
category from 1960 to 1980, with a 5% decrease. At this
point, it had gone back up to the same figure of 70% for 1996 by 2000,
and remained relatively stable until 2019.
Remove the comma
apply
By contrast
, there were not any refrigerators
in homes in 1920. The figures for refrigerators
had, however
, risen to 50% by 1940, and then
continued to grow considerably to such
an extent that took the lead from then
on, with all households possessing them from 1980 onwards.
Moving on to vacuum cleaners, the figures followed a similar pattern to those of refrigerators
, though it
increased steadily. In the early decades of the twenty-first century, Correct pronoun usage
they
this
had the joint-highest percentage of ownership along with
refrigerators
(100%).
In terms of the number of hours spent on household chores, there had been a decrease of 80% (10 hours a week) by the end of the period in question, which contrasts sharply with the number of 50 hours in 1920.Submitted by shirin.khosronejad on
Unauthorized use and/or duplication of this material without express and written permission from this site’s author and/or owner is strictly prohibited. Excerpts and links may be used, provided that full and clear credit is given to Writing9 with appropriate and specific direction to the original content.
Introduction: The introduction is missing.
▼
Introduction: The chart intro is missing.
▼
Basic structure: Use less body paragraphs.
▼
Common mistake: Your writing should be 150-250 words.
Introduction: The chart intro is missing.
▼
Vocabulary: Replace the words refrigerators with synonyms.
▼
Vocabulary: The word "figure" was used 3 times.
▼
Vocabulary: The word "data" was used 2 times.
▼
Vocabulary: The word "number of" was used 2 times.
▼
Vocabulary: The word "percentage" was used 2 times.
▼
Vocabulary: The word "decreased" was used 3 times.
▼
Vocabulary: The word "increased" was used 2 times.
▼