The graph shows data on populations in four countries living in the city from 1970 to 204p

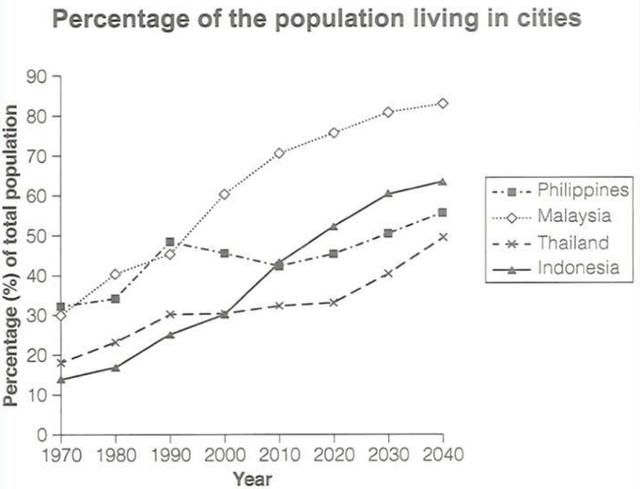
The line graph depicts data regarding occupants in four Asian counties residing in cities between 1970 and 2020, with forecasts for the years 2030 and 2040.
Overall
, all countries show an upward trend of inhabitants living in the city, but, the Philippines is the only country that reports some fluctuations in residents.
In 1970, Malaysia states
that 30% of its population Wrong verb form
stated
is
in the city, Wrong verb form
was
this
percentage steadily inclines
until 1990, Wrong verb form
inclined
where
it Correct word choice
when
is
just over 40%. Hereafter, the proportion of citizens rises steeply to around 60% in 2000 and continues along Wrong verb form
was
this
path till its predicted value in 2040 at above 80% which is the highest point on the graph. Indonesia reports the lowest amount of individuals in cities at greater than 10% in 1970. This
amount grows
until over 20% in 1970. Wrong verb form
grew
Thereafter
, there is a predicted surge in city residents to near
60% in 2040.
Thailand Change the word
nearly
also
indicates an expansion in people from just under 20% in 1970 to less than 30% in 1990 where it plateaus at this
level until 2020 before experiencing another escalation to below 50% in 2040. The Philippines showcase
30% in 1970 where it Wrong verb form
showcased
remains
until 1980 before rising to under 50% in 199p and dropping to approximately 40% in 2010. The quantity of citizens is estimated to rise to more than 50% in 2040.Wrong verb form
remained
Submitted by kellyanne.henney on
Unauthorized use and/or duplication of this material without express and written permission from this site’s author and/or owner is strictly prohibited. Excerpts and links may be used, provided that full and clear credit is given to Writing9 with appropriate and specific direction to the original content.
Vocabulary: Rephrase the word "data" in your introduction.
▼
Vocabulary: The word "graph" was used 2 times.
▼
Vocabulary: The word "amount" was used 2 times.
▼
Vocabulary: The word "rises" was used 2 times.
▼