The graph shows the number of people taking part in 4 kinds of sports in a particular region between 1985 and 2005. Summarise the information by selecting and reporting the main features and make comparisons where relevant.

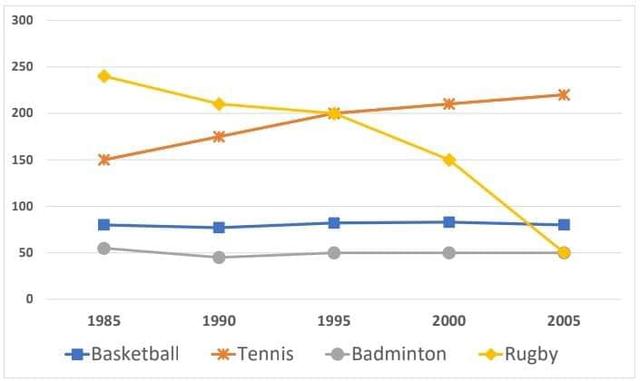
The line graph illustrates citizens who were playing Basketball,
Tennis
, Badminton and soccer in a certain country from 1985 to 2005.
Overall
, the number of players
who were participating in Basketball and Badminton remained steady throughout the given period, while
Tennis
significantly rose and Rugby experienced a downward trend.
In 1985 Rugby players
were the highest among these four games nearly 240 thousand
but it dramatically declined to 50 thousand
players
,exceeding Tennis
players
in 1995. In the meantime, people who were playing Tennis
grew up
steadily to approximately 75 Change preposition
apply
thousand
people.Then
it reached the highest amount end of the period.
In early 1985 Badminton players
recorded nearly 51 thousand
however
it slightly came down by thousands of players
and levelled off until 2005 then
it shared the same number with Rugby was the lowest at the end
of the period. Basketball popularity was minimally change
around 74 and 76 was stabilized between1985 and2015.Change the verb form
was minimally changed
was minimally changing
Submitted by ishanisachithra3 on
Unauthorized use and/or duplication of this material without express and written permission from this site’s author and/or owner is strictly prohibited. Excerpts and links may be used, provided that full and clear credit is given to Writing9 with appropriate and specific direction to the original content.
Vocabulary: Replace the words tennis, players, thousand with synonyms.
▼
Vocabulary: The word "nearly" was used 2 times.
▼