The bar chart below shows the percentage of Australian men and women in different age groups who did regular physical activity in 2010. Summarize the information by selecting and reporting the main features, and make comparisons where relevant.

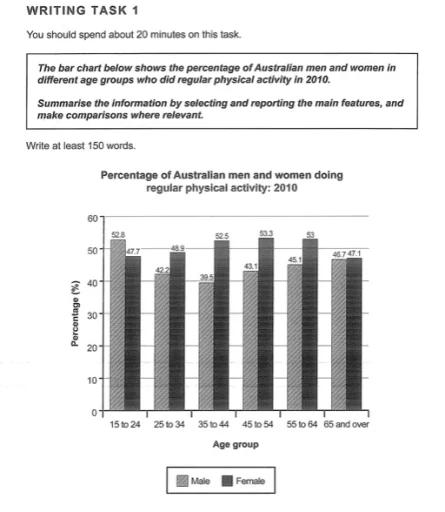
The bar chart illustrates the regular physical activity had been participated of males and females in different age groups of the ratio of Australia in 2010.
Overall
, a major physical activist was women 53.3% at the age of 45 to 54 and a minor body exercise was men 39.5% at the maturity of 35 to 45.
However
, guys were 52.8% and girls were 47.7% in the maturity group of 15-24. Also
, boys were reduced by 42.2% and girls increased by 1.2% in the group of 25-34. Moreover
, boys decreased by 39.5% and girls bloomed by 52.5% in 35-45 in maturity. As per the record, mothers were increasing their numbers.
Furthermore
, fathers accounted for 43.1% and mothers participated in 53.3% of 45-54 life. In addition
, now males climbed by 2% of involvement in 55-64 age groups and females were 53%. This
was 0.4% of couples in the last
old group of 65 and over which included in the physical activity camp.
All data describes some variation in people's percentage of involvement which happened in Australia.Submitted by psingh8059 on
Unauthorized use and/or duplication of this material without express and written permission from this site’s author and/or owner is strictly prohibited. Excerpts and links may be used, provided that full and clear credit is given to Writing9 with appropriate and specific direction to the original content.
Vocabulary: Use several vocabularies to present the data in the second paragraph.
▼