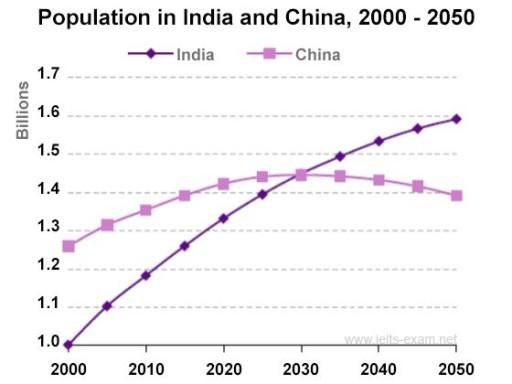
The graph below shows population figures for India and China since the year 2000 and predicted population growth up until 2050.

The line graph compares the number of people living in two distinct Asian countries, namely
India
and China, from 2000 to 2050. Overall
, those countries experienced an opposite trend. The former had a growing pattern, while
the latter saw a downturn.
In 2000, China managed to outperform India
, with a gap of 0.3 billion people. Unfortunately, they were surpassed by the
Correct article usage
apply
India
because their increase was less than India
's rise. In the following year, they were unable to catch up because they continued to fall, with the gaps widenning
.
Correct your spelling
widening
On the other hand
, India
started to have a
consistent annual growth, with an additional around 0.1 Remove the article
apply
billions
per year. It was projected that they would lead the world's population by 2050Change to singular
billion
,
when there will be 1.6 billion people on Remove the comma
apply
this
trajectory.Submitted by msdedew10 on
Unauthorized use and/or duplication of this material without express and written permission from this site’s author and/or owner is strictly prohibited. Excerpts and links may be used, provided that full and clear credit is given to Writing9 with appropriate and specific direction to the original content.
Common mistake: Your writing should be 150-250 words.
Vocabulary: Replace the words india with synonyms.
▼