The bar chart below shows average UK salaries, by city. Summarise the information by selecting and reporting the main features, and make comparisons where relevant. You should write at least 150 words.

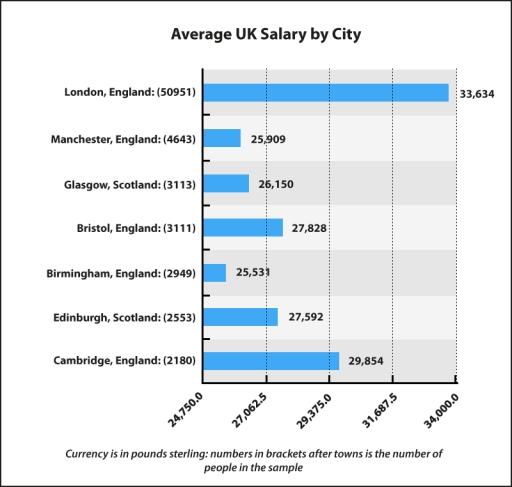
The bar chart below illustrates average incomes by city in the UK, detailing the number of people in each sample and their average
salary
. Overall
, the chart highlights a significant salary
disparity among cities
in England, while
cities
in Scotland show more uniform averages.
One notable observation is the higher salaries of
London and Cambridge, both in England, compared to other Change preposition
in
cities
. Specifically, London's average salary
is £33,634, followed by £29,854 in Cambridge.
Interestingly, Bristol in England and Edinburgh in Scotland show similar income levels, despite being in different regions, with both cities
having an average salary
of approximately £27,500.
Lastly
, Manchester, Glasgow, and Birmingham exhibit lower incomes compared to other cities
. Birmingham has the lowest average salary
at £25,531, followed by Manchester at £25,909 and Glasgow at £26,150.Submitted by mayu1022.p on
Unauthorized use and/or duplication of this material without express and written permission from this site’s author and/or owner is strictly prohibited. Excerpts and links may be used, provided that full and clear credit is given to Writing9 with appropriate and specific direction to the original content.
Sentences: Add more complex sentences.
▼
Common mistake: Your writing should be 150-250 words.
Vocabulary: Rephrase your introduction. Words match: 67%.
▼
Vocabulary: Replace the words salary, cities with synonyms.
▼
Vocabulary: The word "chart" was used 2 times.
▼
Vocabulary: The word "compared" was used 2 times.
▼
Vocabulary: The word "show" was used 2 times.
▼