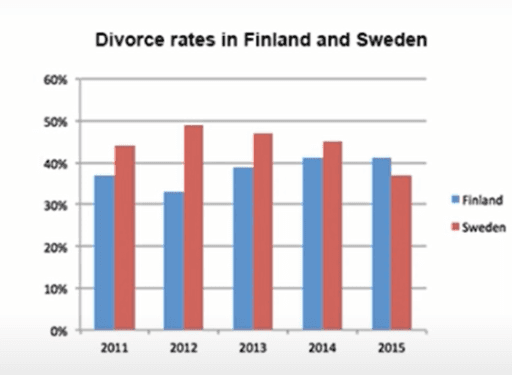
The bar chart chart shows the divorce rates in two European countries from 2011 to 2015.

Given is a graph comparing and contrasting the information germane to
percentage
of divorces in two European countries namely; Add an article
the percentage
a percentage
Finland
and Sweden throughout the span of 2011 and 2015.
From a cursory glance its
manifest that both countries’ divorce rates had some fluctuations. Sweden experienced a downward trend, Replace the word
it's
it is
while
Finland
showed an accumulation throughout the period
. Although
Finland
initially
had a lower rate
, it outraced Sweden at the end
of the period
.
As per
Sweden’s divorce Change preposition
apply
rate
, it was about 45% in 2011, being
higher than Unnecessary verb
apply
Finland
’s rate
by approximately 8%. In 2012, it elevated almost
fifty Change preposition
by almost
percent
. Change the spelling
per cent
However
, the figure showed a gradual decrease to approximately 47% in 2013,
and continued to decline steadily to the end of the Remove the comma
apply
period
, reaching around 45% in 2014 and experienced
its nadir at about 37% in 2015.
As for Wrong verb form
experiencing
Finland
, divorcement
Correct article usage
the divorcement
rate
was less than 40% in 2011, and it tumbled in 2012 to 32%. However
, the figure experienced a
steady growth during the Remove the article
apply
period
. It proliferated to approximately 41% in 2014 and remained steady for the next
year.Unauthorized use and/or duplication of this material without express and written permission from this site’s author and/or owner is strictly prohibited. Excerpts and links may be used, provided that full and clear credit is given to Writing9 with appropriate and specific direction to the original content.
Sentences: Add more complex sentences.
▼
Linking words: Don't use the same linking words: "however".
▼
Introduction: The introduction is missing.
▼
Introduction: The chart intro is missing.
▼
Introduction: The chart intro is missing.
▼
Vocabulary: Replace the words finland, period, rate with synonyms.
▼
Vocabulary: The word "figure" was used 2 times.
▼
Vocabulary: The word "showed" was used 2 times.
▼
Vocabulary: The word "approximately" was used 3 times.
▼
Vocabulary: The word "about" was used 2 times.
▼