The chart below shows three different types of crime in England and Wales from 1970 to 2005. Summarize the information be selecting and reporting the main features and make comparisons where relevant.

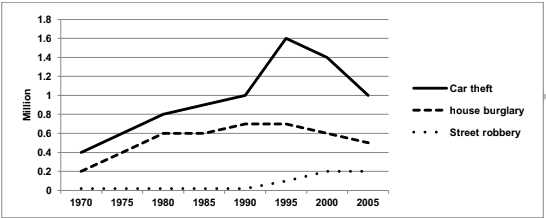
The graph below shows the changing
number
of three distinctive kinds of crime, covered
a period from
1970 to 2005 in England and Wales.
It is noticeable that both car theft and house burglary performed Wrong verb form
covering
a
same fluctuation in rates. On the
contrary, the level of street robbery went up gradually between 1970 and 2005.
Correct article usage
the
According to
the information given by the graph, car theft started with the lowest number
, at 0.4
million
in 1970 and kept growing dramatically to hit the highest number
in 1995 for
about 1.6 Change preposition
of
million
. In the remaining time, the graph dropped significantly. However
, the rate of house burglary, which began with
0.2 Change preposition
at
million
, grew more
slightly and remained steady at the highest point from 1990 to 1995 Correct quantifier usage
apply
then
fell.
The number
of street robbery
was approximately 0 until it rose slightly in 1990, Fix the agreement mistake
robberies
then
hit the highest
point in 2000, at 0.2 million
. In the period from 2000 to 2005, the number
of street robbery
remained stable with trivial change.Fix the agreement mistake
robberies
Unauthorized use and/or duplication of this material without express and written permission from this site’s author and/or owner is strictly prohibited. Excerpts and links may be used, provided that full and clear credit is given to Writing9 with appropriate and specific direction to the original content.
Sentences: Add more complex sentences.
▼
Basic structure: Use less body paragraphs.
▼
Basic structure: Change the second paragraph.
▼
Basic structure: Change the third paragraph.
▼
Vocabulary: Replace the words number, million with synonyms.
▼
Vocabulary: Rephrase the word "shows" in your introduction.
▼
Vocabulary: The word "graph" was used 3 times.
▼
Vocabulary: The word "number of" was used 3 times.
▼
Vocabulary: The word "remained" was used 2 times.
▼
Vocabulary: The word "slightly" was used 2 times.
▼
Vocabulary: Use several vocabularies to present the data in the second paragraph.
▼
Vocabulary: Use several vocabularies to present the data in the third paragraph.
▼