The pie charts below give information about the composition of household rubbish in the United Kingdom in two different years. Summarise the information by selecting and reporting the main features, and make comparisons where relevant.

#information #composition #household #rubbish #kingdom #two #years #summarise #features #comparisons
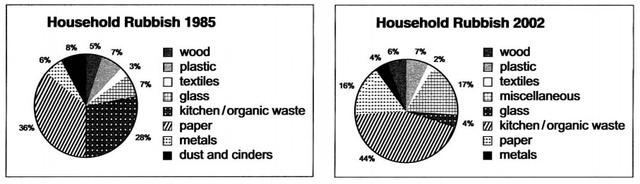
These two pie charts illustrate the data about the composition of household trash for the United Kingdom in 2 different years: 1985 and 2002. There are 8 categories, based on different types of rubbish.
On the first pie chart, it shows that 36% of trash is paper in 1985. The
second
biggest segment is kitchen/organic waste at 28%. The rest parts are: both metals and wood at 8% and glass with plastic make up 14% in total. The smallest part is dust and cinders at 5%.
In the second
pie chart, dust and cinders are replaced with miscellaneous. There are about 16% of paper followed by 44% of kitchen/organic waste in 2002. 17% of chart belongs to miscellaneous, plastic and wood at 7 and 6% respectively. To give a glance at small parts, it can be seen, that both metals and glass make up 8% in sum. Textiles have the smallest proportion, at just 2%.
As an overall
trend, while
the percentage for the majority types of rubbish falls, the kitchen/organic waste rises.Submitted by akmalkarimov164 on
Unauthorized use and/or duplication of this material without express and written permission from this site’s author and/or owner is strictly prohibited. Excerpts and links may be used, provided that full and clear credit is given to Writing9 with appropriate and specific direction to the original content.
Linking words: Don't use the same linking words: "second".
▼
Vocabulary: Rephrase your introduction. Words match: 73%.
▼
Vocabulary: The word "charts" was used 4 times.
▼
Vocabulary: The word "about" was used 2 times.
▼