The graph shows the percentage of male and female academic staff members across the faculties of major university in 2012.

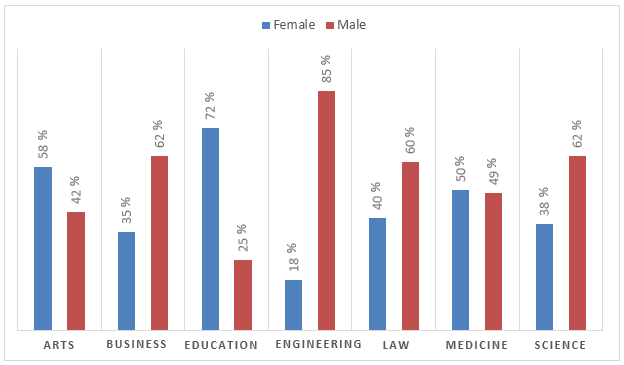
The bar graph indicates how many people were part of the academic staff in the faculties of a major university in 2012, with a
further
classification by gender. As illustrated by the graph, the percentage of male academic staff members was significantly higher in faculties that deal with science and engineering compared with the percentage of female colleagues.Submitted by marikaki.per on
Unauthorized use and/or duplication of this material without express and written permission from this site’s author and/or owner is strictly prohibited. Excerpts and links may be used, provided that full and clear credit is given to Writing9 with appropriate and specific direction to the original content.
Sentences: Add more complex sentences.
▼
Linking words: Add more linking words.
▼
Basic structure: Write more paragraphs.
▼
Basic structure: Add more body paragraphs.
▼
Common mistake: Your writing should be 150-250 words.
Basic structure: Write more paragraphs.
▼
Vocabulary: Rephrase your introduction. Words match: 83%.
▼
Vocabulary: Rephrase the word "percentage" in your introduction.
▼
Vocabulary: Only 6 basic words for charts were used.
▼
Vocabulary: The word "graph" was used 2 times.
▼
Vocabulary: The word "percentage" was used 2 times.
▼