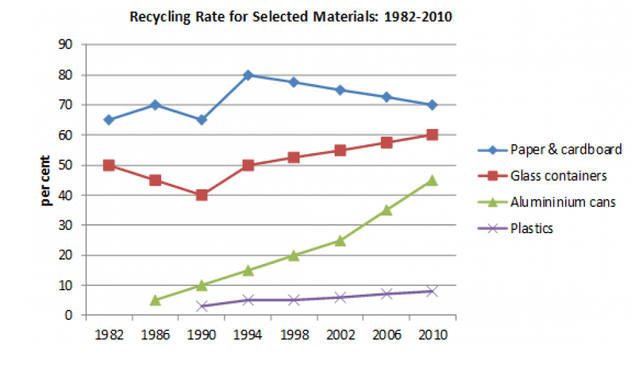
The graph below shows the proportion of four different materials that were recycled from 1982 to 2010 in a particular country.

The graph illustrates the percentage of four different
materials
(paper and cardboard, glass containers, aluminium cans and plastics) which underwent the recycling process between 1982 and 2010.
Overall
, paper and cardboard were mostly recycled materials
, although
thealthough
the trend was downward for these Correct your spelling
although
the although
materials
while
others experienced an upward trend. Even though there were some fluctuations.
It can be seen that,
Remove the comma
apply
paper
and cardboard recycling standard was higher than that Correct article usage
the paper
other
Change preposition
of other
material
well under 70% in 1982.Followed by 5% percentage was going up in 1986 but in 1990 suddenly dropped Fix the agreement mistake
materials
around
65%.In Change preposition
to around
later
year (Add an article
the later
a later
in
1994) fluctuated and rose over 80%. From 1994 to 2010 Change preposition
apply
this
amount gradually declined and hit to
70%.Compared to other Change preposition
apply
materials
this
rate was higher.
In 1982, containers which were made of glass raised by 5%.Moreover
, this
percentage was
significantly decreased (40%) in 1990.Unnecessary verb
apply
in addition
, in next
year the peak was, Correct article usage
the next
same
as it was Correct article usage
the same
initially
(50%).And started continuously rising throughout the period, then
reached to
60% in 2010.
It is interesting that the two remaining Change preposition
apply
materials
(aluminium cans and plastics) followed the same pattern whilst aluminium cans started being recycled in 1986(considerably less than 10%). It was clear that this
process significantly went up to 45% in 2010. Least recycling process made by plastics from binging to end of the period (under 5% to close to 10%).Unauthorized use and/or duplication of this material without express and written permission from this site’s author and/or owner is strictly prohibited. Excerpts and links may be used, provided that full and clear credit is given to Writing9 with appropriate and specific direction to the original content.
Vocabulary: Replace the words materials with synonyms.
▼
Vocabulary: The word "percentage" was used 3 times.
▼
Vocabulary: The word "trend" was used 2 times.
▼
Vocabulary: The word "go" was used 2 times.
▼
Vocabulary: The word "fluctuations" was used 2 times.
▼
Vocabulary: The word "significantly" was used 2 times.
▼