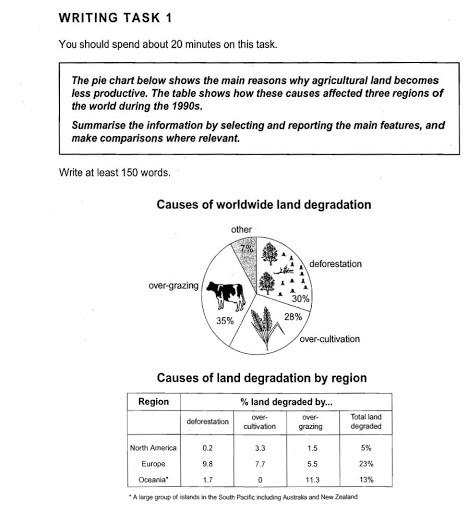
The pie chart below shows the main reasons why agricultural land becomes less productive. The table shows how these causes affected three regions of the world during the 1990s. Summarise the information by selecting and reporting the main features, and make comparisons where relevant.

Reasons leading the global
land
degradation are illustrated in the pie chart, which is followed by a table providing a breakdown of data upon
the influence of those causes on three areas of the world, including North America, Europe and Oceania in the 1990s. All figures are measured in percentage.
Change preposition
on
Overall
, it is clear from the first graph that both over-grazing and deforestation were two
main culprits reducing Correct article usage
the two
land
productivity. As a consequence
, Europe had been affected most severely in
Change preposition
by
land
degradation during the 1990s.
Looking at the pie chart, 35% of the total land
was degraded by over-grazing, which was followed by 30% deforested. Over-cultivation was also
responsible for the reduction in quality of 28% of soil meanwhile other factors were not be
significant factors.
Change the verb form
were not
According to
data from the table, the proportion of infertile soil in Europe reached nearly a quarter of total
Add an article
the total
land
area. Whereas
, the figure in Oceania was nearly a
half; Correct article usage
apply
however
, it was
suffered the biggest impact from over-grazing. Unnecessary verb
apply
In contrast
, only 5% unproductive
Change preposition
of unproductive
land
made North America became the least affected region among
Change preposition
of
three
areas in the year of 1990s.Correct article usage
the three
Unauthorized use and/or duplication of this material without express and written permission from this site’s author and/or owner is strictly prohibited. Excerpts and links may be used, provided that full and clear credit is given to Writing9 with appropriate and specific direction to the original content.
Vocabulary: Replace the words land with synonyms.
▼
Vocabulary: The word "chart" was used 2 times.
▼
Vocabulary: The word "table" was used 2 times.
▼
Vocabulary: The word "figures" was used 2 times.
▼
Vocabulary: The word "data" was used 2 times.
▼
Vocabulary: The word "nearly" was used 2 times.
▼