The graph below shows the proportion of the population aged 65 and over between 1940 and 2040 in three different countries

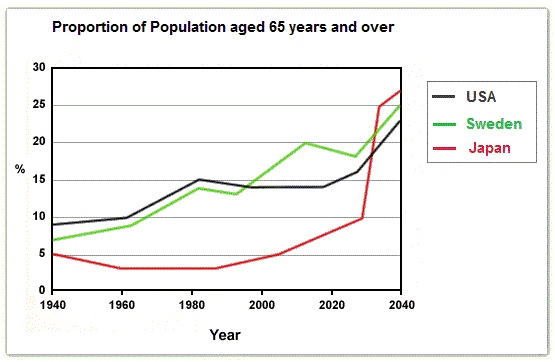
The following chart demonstrates differences in the population rate among elderly
people
from 65 and over since 1940 and there is also
given a predictable rise until 2040 in the USA
, Sweden
and Japan
.
It is clear from the graph that the number of old aged people
in all three countries is expected to have an upward trend.
Now turning to the details, first
20 years saw a gradual rise in the Correct article usage
the first
amount
of elderly Change the quantifier
number
people
in the USA
and Sweden
as opposed to a gradual decrease by
almost 2% in Change preposition
of
Japan
.
According to
the graph, we can see that there was a significant increase of
old aged Change preposition
in
people
by just over 5% in the USA
and Sweden
between 1960 and 1980, while
the percentage of old Japaneses
stayed constant and remained at 3%.
Before a steady growth at 14%, almost until 2018, the proportion of American elderly Correct your spelling
Japanese
people
decreased slightly by 2% in 1995. The old aged
population rate in Replace the word
age
Japan
, in
contrast
rose by 2% in 2000, Add the comma(s)
,contrast
by
reaching the same level as in 1940.
It is interesting that since 2000 the amount of old Change preposition
apply
people
in Japan
has increased moderately and 2030 is predicted to see a
dramatic growth and will peak at 25%.
Remove the article
apply
Next
20 years in the Correct article usage
The next
USA
are expected to see a gradual rise in scale
of old Add an article
the scale
people
, which will reach almost 23%, while
before a gradual growth in 2025, the old people
scale in Sweden
will decrease slightly by approximately 5%.
Overall
, in the future is predicted that a
longevity among elderly Remove the article
apply
people
will increase in the USA
, Sweden
and Japan
.Submitted by iooganbekov on
Unauthorized use and/or duplication of this material without express and written permission from this site’s author and/or owner is strictly prohibited. Excerpts and links may be used, provided that full and clear credit is given to Writing9 with appropriate and specific direction to the original content.
Linking words: Don't use the same linking words: "while".
▼
Basic structure: Use less body paragraphs.
▼
Common mistake: Your writing should be 150-250 words.
Vocabulary: Replace the words people, usa, sweden, japan with synonyms.
▼
Vocabulary: The word "graph" was used 2 times.
▼
Vocabulary: The word "amount" was used 2 times.
▼
Vocabulary: The word "decrease" was used 3 times.
▼
Vocabulary: The word "growth" was used 3 times.
▼
Vocabulary: The word "increase" was used 3 times.
▼
Vocabulary: The word "rise" was used 3 times.
▼
Vocabulary: The word "almost" was used 3 times.
▼
Vocabulary: The word "gradual" was used 4 times.
▼
Vocabulary: The word "slightly" was used 2 times.
▼