The graph below shows the quantities of goods transported in the UK between 1974 and 2002 by four different modes of transport.

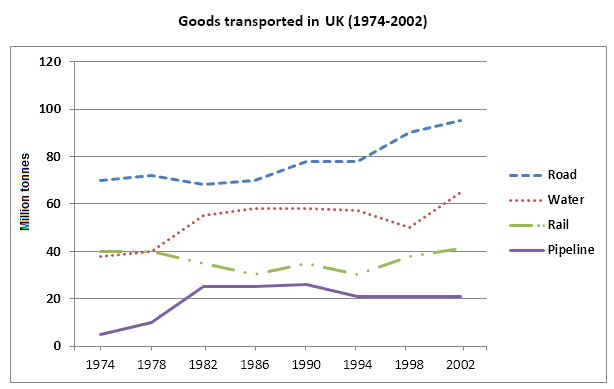
The graph illustrates the number of capitals conveyed in Great Britain from 1974 to 2001.
According to
graph, over a 28 years the means of transportation included: the road
vehicles, the water, the rail
transports and the modes of pipeline
ways. The highest level of volume had detected approximately 98 million tonnes (2002) and by contrast
, the lowest had noticed about 5 million tonnes by road
transports and with the pipeline
relatively.
The services were carried away with the most considerable volume by road
remains between 1974-2001, additionally
the proportion of road
goods slightly was peaking up year by year till 2002. Until 1978, the water and the rail
had been vied, whereby the former passed away the rail
transportation. Notwithstanding, the total volume of pipeline
increased, its numbers had mild fluctuations during these years.
Overall
, The road
was the initial mode of transport carried capitals, next
means of transportation were as follows: the second
a water conveyance (after 1978), the third
a rail
transit (after 1978) and the final a pipeline
mean.Unauthorized use and/or duplication of this material without express and written permission from this site’s author and/or owner is strictly prohibited. Excerpts and links may be used, provided that full and clear credit is given to Writing9 with appropriate and specific direction to the original content.
Vocabulary: Replace the words road, rail, pipeline with synonyms.
▼
Vocabulary: The word "graph" was used 2 times.
▼
Vocabulary: Use several vocabularies to present the data in the fourth paragraph.
▼