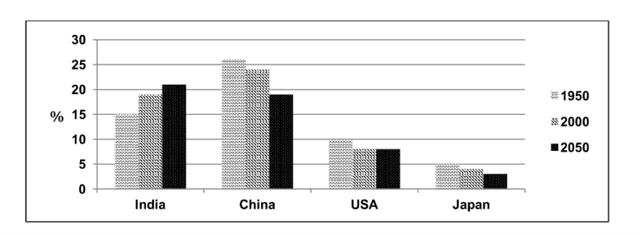
The bar chart shows the percentage of the total world population in 4 countries in 1950 and 2003, and projections for 2050. Summarise the information by selecting and reporting the main features and make comparisons where relevant. You should write at least 150 words. Writing Task 1

#bar #percentage #world #population #countries #projections #summarise #information #features #comparisons
The bar chart indicates the
overall
number of
Correct quantifier usage
apply
world
Add an article
the world
population
in India, China
, USA
, and Japan in the time frame 1950 and 2002, with an estimation for 2050 based on the presented data.
It is apparent from the information presented that Correct article usage
the USA
China
dominated and had the highest percentage on the chart which covered nearly 23% of the total world population
in 1950, although
it had
slightly dropped to 20% in 2002. Unnecessary verb
apply
However
, it was estimated that this
figure will continue to go down by 5% in 2050.
In 1950, India came next
in line to China
as the highest number of
Correct quantifier usage
apply
population
globally Add an article
the population
covered
Wrong verb form
covering
the
15% of it. Correct article usage
apply
Comparing
to Wrong verb form
Compared
China
, India had
gradually increased its Unnecessary verb
apply
number of
Correct quantifier usage
apply
population
up to 2002 and was projected to rise up to 18% in 2050.
The USA and Japan just Add an article
the population
covered
around 8% and almost 4% of the total global Correct your spelling
hovered
population
respectively in 1950.It is also
indicated that the population
of the USA will remain steady in 2050 and interestingly, Japan will make a considerable fall of
its Change preposition
in
number of
Correct quantifier usage
apply
population
in the same year.
Overall
, although
it is apparent that China
constituted the population
growth globally, it is also
clear that the government has been trying to control the rising of its number
of people in the near future.Unauthorized use and/or duplication of this material without express and written permission from this site’s author and/or owner is strictly prohibited. Excerpts and links may be used, provided that full and clear credit is given to Writing9 with appropriate and specific direction to the original content.
Linking words: Don't use the same linking words: "also, although, overall".
▼
Vocabulary: Replace the words number, population, china with synonyms.
▼
Vocabulary: The word "chart" was used 2 times.
▼
Vocabulary: The word "indicates" was used 2 times.
▼
Vocabulary: The word "presented" was used 2 times.
▼
Vocabulary: The word "number of" was used 5 times.
▼
Vocabulary: The word "go" was used 2 times.
▼
Vocabulary: The word "go" was used 2 times.
▼