The graphs above give information about computer ownership as a percentage of the population between 2002 and 2010, and by level of education for the years 2002 and 2010. Summarise the information by selecting and reporting the main features, and make comparisons where relevant. Write at least 150 words.

#graphs #information #computer #ownership #percentage #population #level #education #years #summarise #features #comparisons
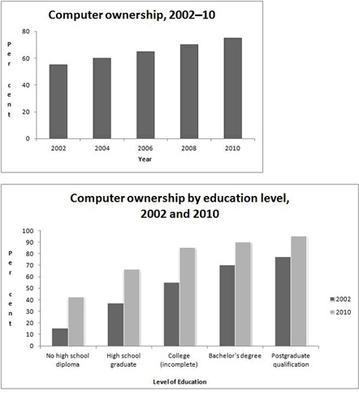
The bar charts show data about
computer
takeover, with a further
classification by level of science, from 2002 to 2010.
A steady but significant rise can be seen in the percentage of the population that owned a computer
over the period. Just over half the population owned computers in 2002, whereas
by 2010 three out of four people had a home computer
.
An analysis of the data by level of discipline shows that higher levels of teaching correspond to higher levels of computer
holding in both of those years. In 2002, only around 15% of those who did not finish high school had a computer
but this
figure had trebled by 2010. There were also
considerable increases, of approximately 30 percentage points, for those with a high school diploma or an unfinished college study (reaching 65% and 85% respectively in 2010). However
, graduates and postgraduates proved to have the greatest level of holding in 2010, at 90% and 95% respectively, 20 percentage points higher than in 2002.
The last
decade has seen a
substantial growth in Remove the article
apply
computer
property in general, and across all educational levels.Submitted by mikemichael1909 on
Unauthorized use and/or duplication of this material without express and written permission from this site’s author and/or owner is strictly prohibited. Excerpts and links may be used, provided that full and clear credit is given to Writing9 with appropriate and specific direction to the original content.
Vocabulary: Replace the words computer with synonyms.
▼
Vocabulary: The word "show" was used 2 times.
▼
Vocabulary: The word "data" was used 2 times.
▼
Vocabulary: The word "percentage" was used 3 times.
▼