IELTS Academic Writing Task 1 Maps Topics 2026
This list contains a selection of IELTS Academic Writing Task 1 maps topics that were submitted by students who completed the IELTS exam in 2026. Select a topic at random and start practicing and enhancing your writing abilities.
maps
Tarnagul is a small town near Melbourne. The maps show the town's development over a period of time. Summarise the information by selecting and reporting the main features, and make comparisons where relevant.


maps
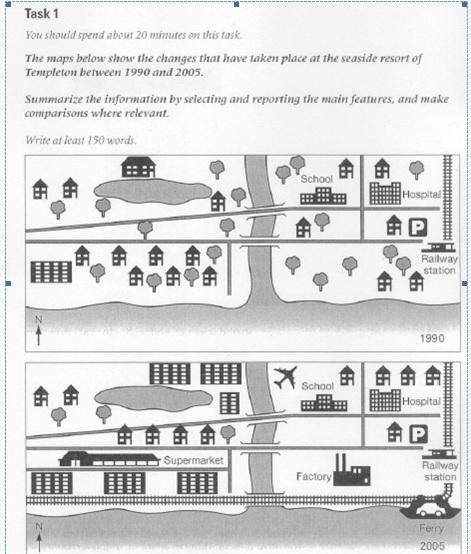
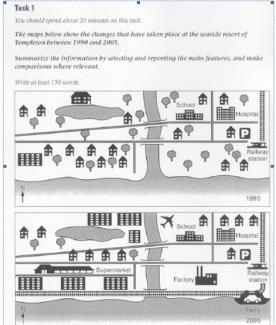
The maps below represent the changes that have taken place at the seaside resort of Templeton between 1990 and 2005.

maps
The maps show the changes of Bill Hill Farm in 1976 and 2008. Summarize the information by selecting and reporting the main features make comparisons where relevant.


maps
The maps below show the centre of a small town called Islip as it is now, and plans for its development. Summarise the information by selecting and reporting the main features, and make comparisons where relevant.


maps
The graphs below show the development of Brindell from 1800 to 2000. Summarize the information by selecting and reporting the main features, and make comparisons where relevant.
maps
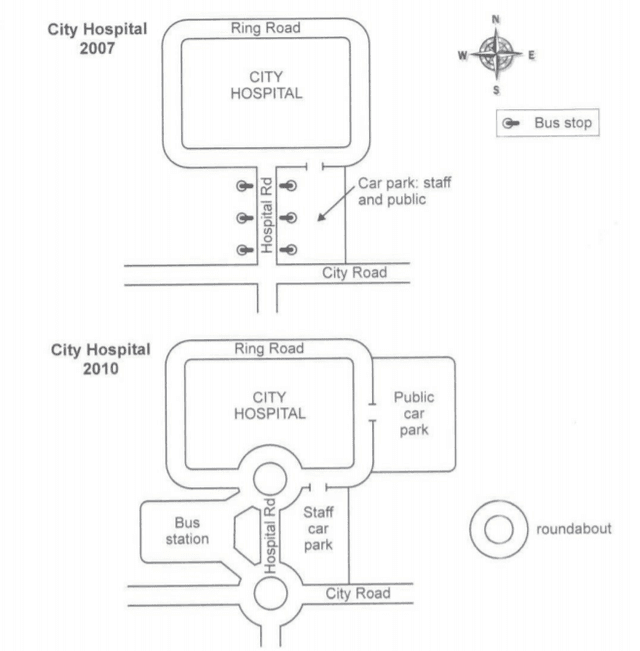
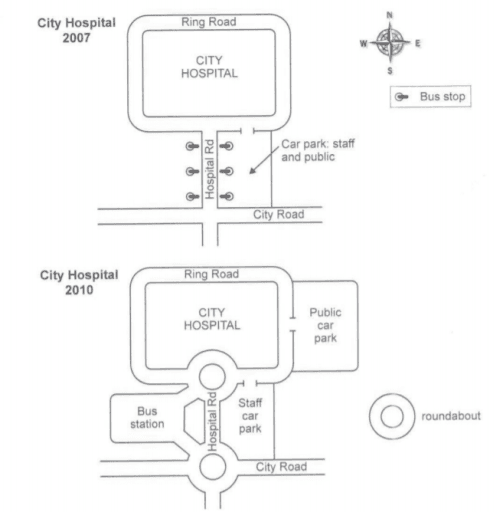
The two maps below show road access to a city hospital in 2007 and in 2010. Summarise the information by selecting and reporting the main features, and make comparisons where relevant.


maps
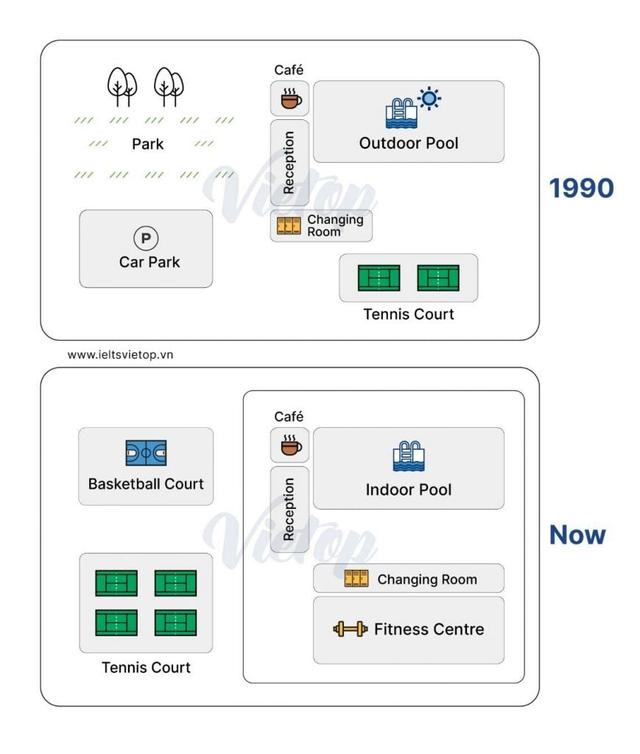
The two maps below give information about the facilities of a university sports court in 1990 and the present. Summarise the information by selecting and reporting the main features, and make comparisons where relevant.


maps
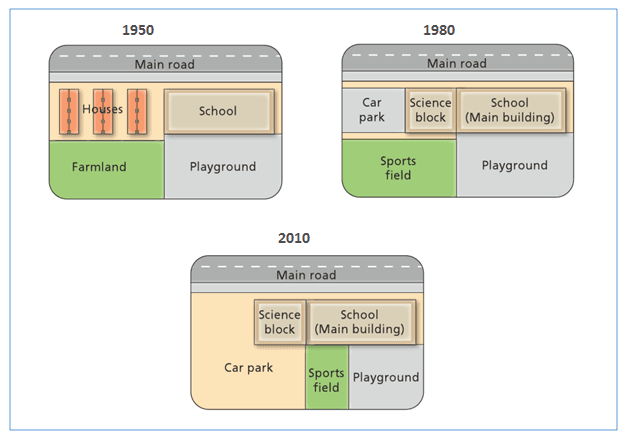
The diagram below show the changes that have taken place at West Park Secondary School since its construction in 1950.


maps
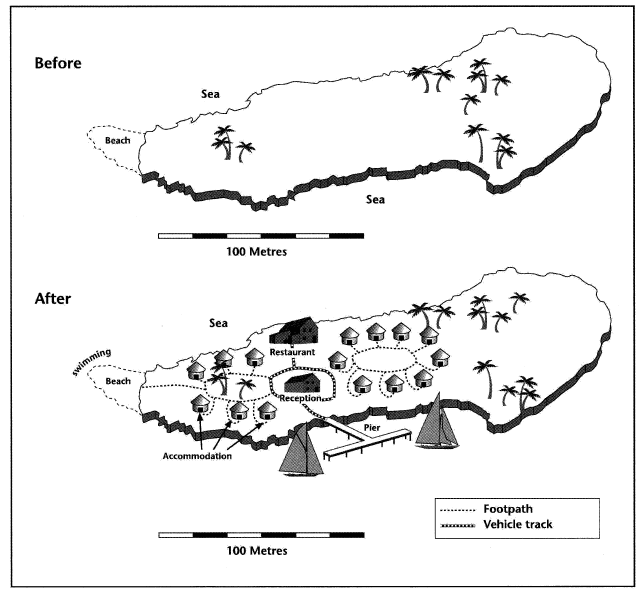
The Maps below show the paradise Island in past and present. Summarize the information by selecting and reporting the main features, and make comparison where relevant.


maps
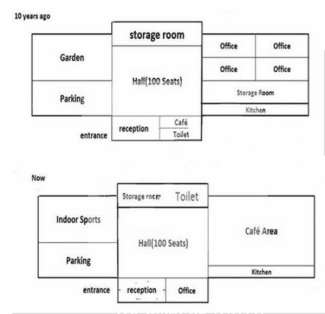
The diagram below shows the floor plan of a public library 20 years ago and how it looks now. Summarise the information by selecting and reporting the main features, and make comparisons where relevant.


maps
The maps show changes that took place in Youngsville in New Zealand over a 25-year period from 1980 to 2005. Summarise the information by selecting and reporting the main features and make comparisons where relevant
maps
The two maps give information about some changes in the layout of Buduran beach town during the 29-year period since 1995.


maps
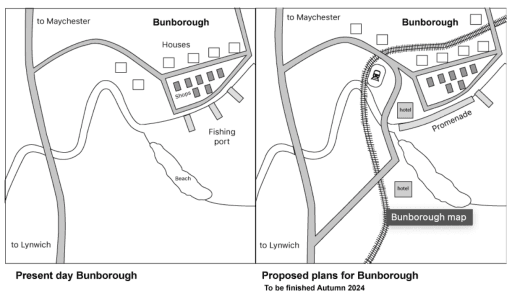
The two maps below show the village of Bunborough in the present day and plans for the village in 2024. Summarise the information by selecting and reporting the main features and make comparisons where relevant.


maps
The maps below show a plan of a city in 1950 and at the present. Summarize the information by selecting and reporting the main features, and make comparisons where relevant.


maps
The maps below show the site of an airport now and how it will look after redevelopment next year. Summarise the information by selecting and reporting the main features, and make comparisons where relevant. Beka


maps
The maps below show the centre of a small town called Islip as it is now, and plans for its development. Summarise the information by selecting and reporting the main features, and make comparisons where relevant. Islip town centre now Countryside Shops Main road Shops Housing E Park School Housing Islip town centre: planned development W E Dual-» carriageway Bus Shopping Car station centre park Pedestrians only Shops Housing New housing New housing Park School Housing


maps
The two maps below show substantial changes of an island befor and after equipment of some tourist facilities.


maps
The maps provide a comparison of the town of Seatown and the changes it has witnessed from 1995 to the present day.


maps
The diagram below shows the floor plan of a public library 20 years ago and how it looks now. Summarize the information by selecting and reporting the main features, and make comparisons where relevant

maps
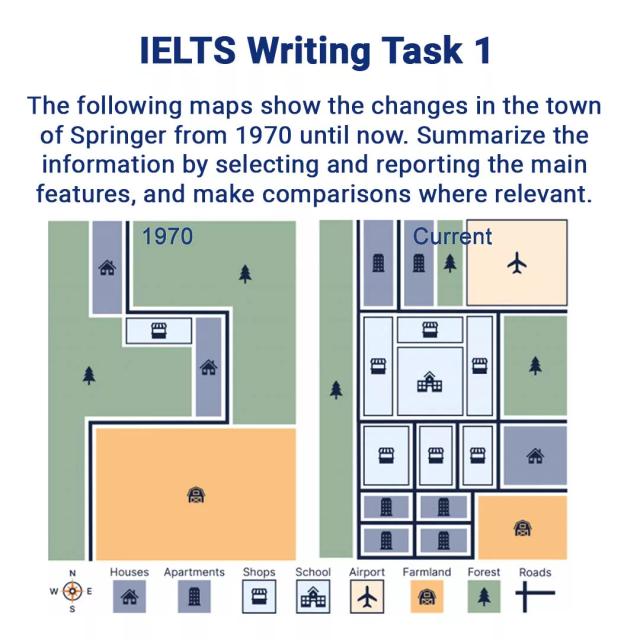
The following maps show the changes in the town of Springer from 1970 until now. Summarize the information.
maps
The diagram below show the site of a school in 2004 and the plan for changes to the school site in 2024. Summarise the information by selecting and reporting the main features, and make comparisons where relevant.


maps
The two maps shows a small village in the west of Ireland in teh year 2000 and at present time. Summarize the information and make comparisons where relavant.


maps
The diagram below shows the proposed changes to an office building. Summarize the information by selecting and reporting the main features and make comparisons where relevant.


maps
The maps below show the centre of a small town called Islip as it is now, and plans for its development. Summarise the information by selecting and reporting the main features, and make comparisons where relevant. Islip town centre now Countryside Shops Main road Shops Housing E Park School Housing Islip town centre: planned development W E Dual-» carriageway Bus Shopping Car station centre park Pedestrians only Shops Housing New housing New housing Park School Housing PA


maps
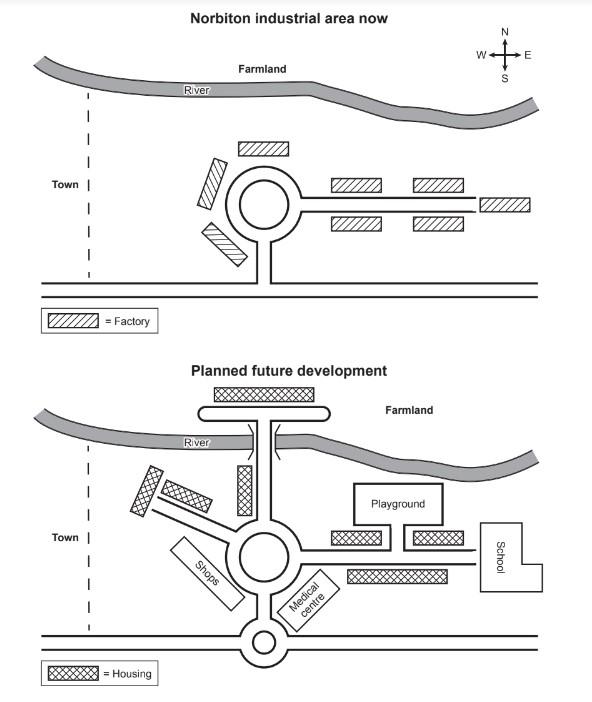
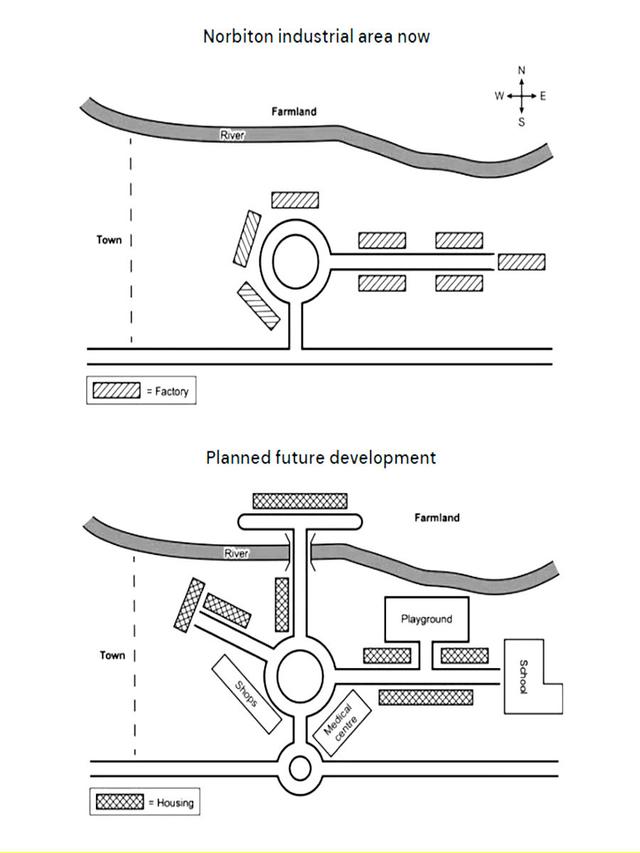
The maps below show an industrial area in the town of Norbiton , and planned future development of the site . Summarise the information by selecting and reporting the main features , and make comparisons where relevant. Assel The maps below show an industrial area in the town of Norbiton , and planned future development of the site . Summarise the information by selecting and reporting the main features , and make comparisons where relevant. Assel


maps
The diagram below show the coastal village of Seaville in 1980 and 2010. Summarise the information by selecting and reporting the main features and make comparisons where relevant.


maps
The maps compare the different of the town name Youngsville in New Zealand over the period of 25 years starting from 1980

maps
The graphs below show the site of an airport now and how it will look after redevelopment next year. Summarise the information by selecting and reporting the main features, and make comparisons where relevant.


maps
The diagram below shows the changes, which took place in a coastal area called Pentland from 1950 to 2007. Write a report for a university lecturer describing the diagrams below.


maps
The two maps below show road to a city hospital in 2007 and 2010. Summarise the information by selecting and reporting the main features and make comparisons wherever relevant.


maps
The maps below show an Industrial area in the town of Norton, and planned future development of the site.


maps
The diagram below shows the floor plan of a public library 20 years ago and how it looks now. Summarize the information by selecting and reporting the main features, and make comparison where relevant.
maps
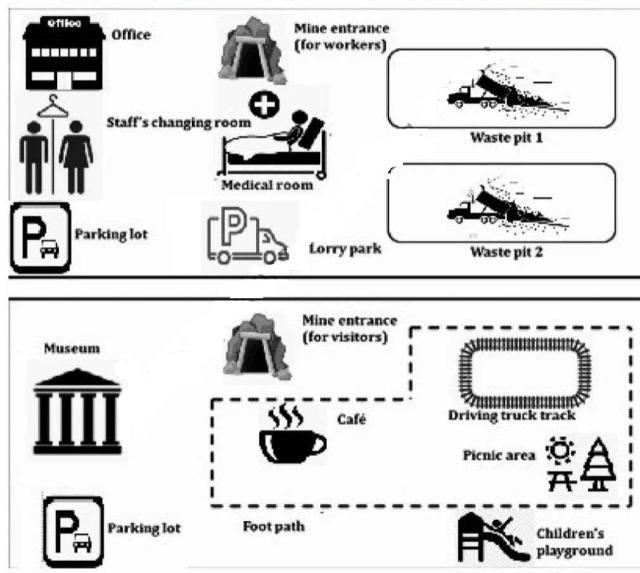
The maps show the changes in the functional area of a museum in 1988 and after the decoration in 2008. Summarise the information by selecting and reporting the main features, and make comparison where relevant.


maps
The graph below gives information about the total oil use of 4 major consumers from 2009 to 2030. Summarise the information by selecting and reporting the main features, and make comparisons where relevant.
maps
There 2 maps of Paradise Island in the past and the present. Summarize the information by selecting and reporting the main features and make comparison where relevant


maps
The maps below show an industrial area in town of Norbition, and planned future development of the site. Summarise the informartion by selecting and reporting the main features and make comparisons where relevant.

maps
The maps below show an industrial area in the town of Norbiton, and planned future development of the site.


maps
The two maps below show the village of Bunborough in the present day and plans for the village in 2024.
maps
The maps show Southside, a shopping mall, as it is now, and plans for its development. Summarise the information by selecting and reporting the main feautures, and make comparisons where relevant.


maps
the maps below show an industrial area in the town of norbiton and planned future development of the site. summarises the information by selecting and reporting the main features and make comparisons where relevant.


maps
The maps show the current and future planned development of the Islip town centre and describe the comparisons of the changes over both time periods.
maps
The two maps below show road access to a city hospital in 2007 and in 2010. Summarise th einformation by selecting and reporting the main features, and make comparisons where relevant

maps
The maps below show an industrial area in the town of Norbiton, and planned future devlopment of the site. Summarize the information by selecting and reporting the main features, and make comparisons where relevant.

maps
The two maps below show the island, before and after the constructions of some tourist facilities. Summarise the information by selecting and reporting the main features, and make comparisons where relevant.

maps
The maps below show the center of a small town called Lslip as it is now, and plans for its development.

maps
The maps below show a beachfront area in Australia in 1950 and today Summarize the information by selecting and reporting the main features, and make a comparisons where relevant.


maps
The maps below show changes to the ground floor plan of a university department in 1980 and 2010. Summarize the information by selecting and reporting the main features and make comparisons where relevant.


maps
The maps below show a harbour in 2000 and how it looks today. Summerise the information by selecting and reporting the main features, and make comparisons where relevant. Umar


maps
The maps below show the changes that have taken place at Queen Mary Hospital since its construction in 1960. Summarise the information by selecting and reporting the main features, and make comparisons where relevant.


maps
The maps show Southside, a shopping mall, as it is now, and plans for its development. Summarise the information by selecting and reporting the main features, and make comparisons where relevant.


maps
The two maps below show an island, before and after the construction of some tourist facilities. The two maps below show an island, before and after the construction of some tourist facilities.

maps
The maps below shows the center of the small town called birshire as it is now and plan for its development


maps
The maps below shows university sports courts in 1990 and now. Summarise the information by selecting and reporting the main features, and make comparisons where relevant. Assel

maps
The given maps represent Grange Park in 1920 and the same park today. Overall, many facilities were constructed, except entrance place everything had changed gradually.


maps
The maps below show an industrial area in town of Norbiton, and planned future development of the site Summarise the information by selecting and reporting the main features, and make cmparisons where relevant

maps
the maps below show an industrial area in the town of Norbition, and planned future development of the site summerise the infotmation by selecting and reporsting the main features and make comparision when relevant


maps
The maps below show the village of Stokeford in 1930 and 2010. Summarise the information by selecting and reporting the main features, and make comparisons where relevant. Umar


maps
The maps show changes that took place in Youngsville in New Zealand over a 25 year period from 1980 to 2005. Summarise the information by selecting and reporting the main features and make comparisons where relevant
maps
The two maps below show an island before and after the construction some of tourists facilities. Summarise the information by selecting and reporting the main features, and make comparisons where relevant.

maps
The two maps below show the village of Bunborough in the present day and plans for the village in 2024. Summarise the data by selecting and reporting the main features and make comparisons where relevant.

maps
The two maps illustrate how Tempton, a seaside resort, developed in a period of thirteen years, from 2000 to 2013.

maps
The maps below show the changes of a school from 1985 to the present time. Summarize the information by selecting and reporting the main features and make comparisons where relevant

maps
The two maps below show the changes that have taken place in the town of Westley since 1815. Summarise the information by selecting and reporting the main features, and make comparisons where relevant.


maps
The maps below show recent changes in the town of Kimsville. Summarize the information by selecting and reporting the main features, and make comparsions where relevant.


maps
The maps show the town of Stokeford in 1930 and 2010. Write a report of at least 150 words, summarizing the main feature and making comparison where relevant.

maps
The maps show improvements that have been made to a university campus between 2006 and the present day. Summarize the information by selecting and reporting the main features, and make comparisons where relevant.


maps
The maps below show changes in the Spanish city of Castellon in recent times. Summarize the information by selecting the main features, and make comparisons where relevant


maps
The maps belowshow an industrialarea in the town ofNorbiton, andplanned future development of the site. Summarise the information by selecting and reporting the main features, and make comparisons where relevant.
maps
The maps below show the village of Stokeford in 1930 and 2010. Summaries the information and reporting the main features and make comparison where relevant.

maps
The diagram below show the change that have taken place ar queen mary hospital since its construction in 1960.


maps
The diagrams below show changes that have taken place in the Sawry District neighborhood since 1920. Summarise the information by selecting and reporting the main features and making comparisons where relevant.


🚀 Prepare for IELTS writing section today!
- Unlimited Task 1 & Task 2 checksPractice with essays, charts, and letters.
- Personalized suggestions & mistake analysisSpot every mistake and boost your score.
- Topic ideas & vocabulary helpersExpand your ideas and use the right words.
- Progress trackingWatch your writing improve with every practice.