The table below shows the proportion of different categories of families living in poverty in Australia in 1999.

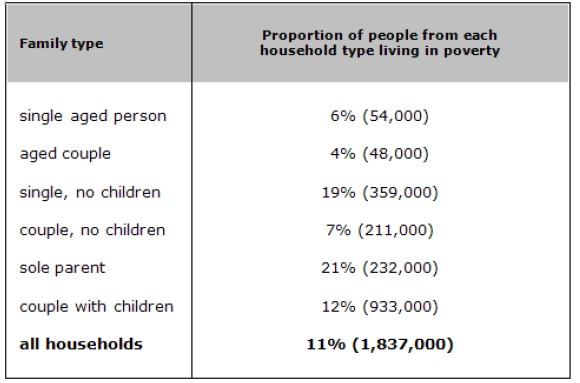
The table illustrates the percentage of different types of families in Australia in 1999.
Overall
, there was a small minority of total household
were comes under the poverty line. In which the highest proportion of poor Fix the agreement mistake
households
were
sole Change the verb form
was
parent
, and Fix the agreement mistake
parents
lowest
Correct article usage
the lowest
were
agreed Change the verb form
was
couple
.
As is given in the table, most of the poor people in Australia were from sale parent Fix the agreement mistake
couples
family
which was exactly 21%, they were followed by single Fix the agreement mistake
families
family
having no children . Fix the agreement mistake
families
Similarly
, couple
with children Fix the agreement mistake
couples
hold
Change the verb form
holds
third
highest poverty Correct article usage
the third
proportional
with 12% .
Replace the word
proportion
Likewise
, couple
without any child and single aged Fix the agreement mistake
couples
person
have a small minority Fix the agreement mistake
persons
was
7% and 6% respectively .The least proportion of people among all poor Unnecessary verb
apply
household
were aged Fix the agreement mistake
households
couple
family
with a tiny fraction of total poot Fix the agreement mistake
families
family
.Fix the agreement mistake
families
Unauthorized use and/or duplication of this material without express and written permission from this site’s author and/or owner is strictly prohibited. Excerpts and links may be used, provided that full and clear credit is given to Writing9 with appropriate and specific direction to the original content.
Common mistake: Your writing should be 150-250 words.
Vocabulary: Replace the words couple with synonyms.
▼
Vocabulary: Only 5 basic words for charts were used.
▼
Vocabulary: The word "table" was used 2 times.
▼
Vocabulary: The word "proportion" was used 2 times.
▼