The graphs below give information about computer ownership as a percentage of the population between 2002 and 2010, and by the level of education for the years 2002 and 2010. Summarise the information by selecting and reporting the main features, and make comparisons where relevant.

#graphs #information #computer #ownership #percentage #population #level #education #years #summarise #features #comparisons
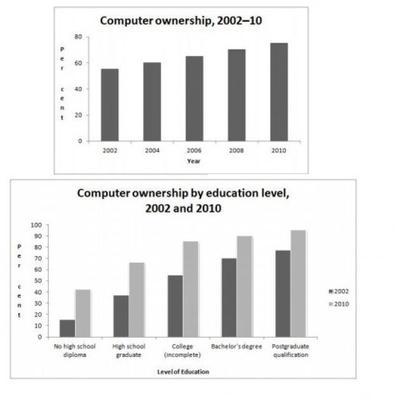
This
bar graph illustrates computer ownership by education level between 2002 and 2020 measured by percentage.
In 2010, no high school
was lower than a high school
graduate diploma
. However
, in 2002, the figure for bachelor
's degree
was more than a college (incomplete) at 90%, Fix the agreement mistake
degrees
85
% respectively the Correct word choice
and 85
trend
of
Change preposition
for
bachelor
's degree
. Reminded nearly stable between 2010 at 90% and 2002 at 70%.
Focusing on 2010, no high Fix the agreement mistake
degrees
school
diploma
was much more than 2002
at 40% and 15% respectively. Moving on Change preposition
in 2002
postgraduate
Change preposition
to postgraduate
qualification
, in 2010, the trend
increased to approximately once fold
at 95%, compared to 2002, where it was at 75%.
Add a hyphen
once-fold
On the other hand
, the figure for high school
graduate
in 2010, was about double times as much as no high Fix the agreement mistake
graduates
school
diploma
at 70% and 39% respectively.
To sum up
, overall
postgraduate Add an article
an overall
qualification
in 2010, was the greatest, while
the same survey in 2020 was the largest in the education level of computer ownership.
This
bar graph illustrates computer ownership by education level between 2002 and 2020 measured by percentage.
In 2010, no high school
was lower than a high school
graduate diploma
. However
, in 2002, the figure for bachelor
's degree
was more than a college (incomplete) at 90%, Fix the agreement mistake
degrees
85
% respectively the Correct word choice
and 85
trend
of
Change preposition
for
bachelor
's degree
. Reminded nearly stable between 2010 at 90% and 2002 at 70%.
Focusing on 2010, no high Fix the agreement mistake
degrees
school
diploma
was much more than 2002
at 40% and 15% respectively. Moving on Change preposition
in 2002
postgraduate
Change preposition
to postgraduate
qualification
, in 2010, the trend
increased to approximately once fold
at 95%, compared to 2002, where it was at 75%.
Add a hyphen
once-fold
To sum up
, overall
postgraduate Add an article
an overall
qualification
Submitted by essraa.29 on
Unauthorized use and/or duplication of this material without express and written permission from this site’s author and/or owner is strictly prohibited. Excerpts and links may be used, provided that full and clear credit is given to Writing9 with appropriate and specific direction to the original content.
Sentences: Add more complex sentences.
▼
Linking words: Don't use the same linking words: "however, overall, to sum up".
▼
Basic structure: Use less body paragraphs.
▼
Common mistake: Your writing should be 150-250 words.
Vocabulary: Replace the words school, diploma, bachelor, degree, trend, qualification with synonyms.
▼
Vocabulary: The word "graph" was used 2 times.
▼
Vocabulary: The word "compared" was used 2 times.
▼
Vocabulary: The word "figure" was used 3 times.
▼
Vocabulary: The word "illustrates" was used 2 times.
▼
Vocabulary: The word "percentage" was used 2 times.
▼
Vocabulary: The word "trend" was used 4 times.
▼
Vocabulary: The word "increased" was used 2 times.
▼
Vocabulary: The word "stable" was used 2 times.
▼
Vocabulary: The word "approximately" was used 2 times.
▼
Vocabulary: The word "nearly" was used 2 times.
▼
Vocabulary: Use several vocabularies to present the data in the fifth paragraph.
▼
Vocabulary: Use several vocabularies to present the data in the ninth paragraph.
▼