The chart and table below give information about population figures in Japan. Summarise the information by selecting and reporting the main features and make comparisons where relevant.

Recapitulate the data provided in the chart form by highlighting the important aspects.
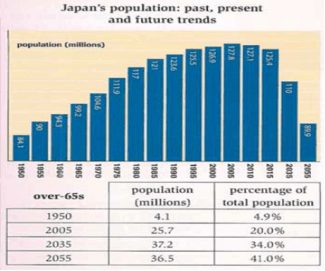
Overall
, the figure represents the increase of
population in Japan from 1950 to 2055. By covering all the trends (past, present, perfect). Change preposition
in
This
information specifically focused on the
people aged 65 or above. The above data is represented in two forms.
The bar chart, they are showing the results of 16 Correct article usage
apply
years
that include their past, present and future. There is a significant increase in the rate for the year 1990 till
2015. These Change preposition
to
years
show the mass is around 125 million. But they are expecting that in the near future
that amount will decrease to about 89 million.
On the other part, the table is in a more summarized format which shows 4 Add a comma
,future
years
of record in two forms (millions and percentage) of the citizens above 65 years
of age. According to
the table results in millions will be at a peak in the year 2035 whereas
the percentage results
will get Change preposition
of results
a
rise in 2025.Correct article usage
apply
Unauthorized use and/or duplication of this material without express and written permission from this site’s author and/or owner is strictly prohibited. Excerpts and links may be used, provided that full and clear credit is given to Writing9 with appropriate and specific direction to the original content.
Introduction: The introduction is missing.
▼
Introduction: The chart intro is missing.
▼
Introduction: The chart intro is missing.
▼
Vocabulary: Replace the words years with synonyms.
▼
Vocabulary: The word "chart" was used 2 times.
▼
Vocabulary: The word "table" was used 2 times.
▼
Vocabulary: The word "present" was used 2 times.
▼
Vocabulary: The word "represents" was used 2 times.
▼
Vocabulary: The word "show" was used 2 times.
▼
Vocabulary: The word "data" was used 2 times.
▼
Vocabulary: The word "percentage" was used 2 times.
▼
Vocabulary: The word "increase" was used 2 times.
▼