
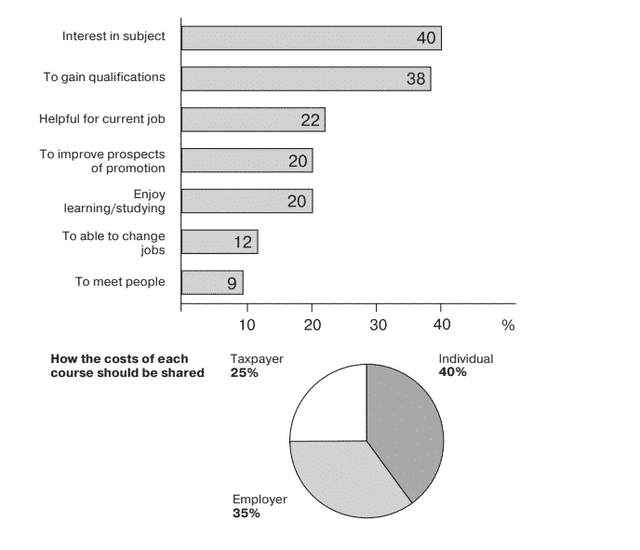
The given
chart
provides information about the results of a survey of adult education. The first Use synonyms
chart
below depicts factors that impacted adults to decide to study. The pie Use synonyms
chart
illustrates how the costs of each course should be distributed.
Use synonyms
It is clear that
interest in subject and qualification gaining were the biggest factors why adults decide to study. It is Linking Words
also
noticed that the survey Linking Words
also
shows that most of the education cost should be funded by individuals themselves.
As can be seen from the Linking Words
chart
the two main purposes why adults continue their studies are because they are interested in the program and to obtain qualification with 40% and 38% respectively. Meanwhile, helpful for the current job, improving prospects of promotion, and enjoying learning or studying were the next reasons in the range between 22% and 20%. Meeting new people and changing jobs were below 15% each Use synonyms
according to
the results of the survey.
Getting back to the details, most people believe that the revenue from the courses should be shared with individuals, taxpayers, and employers. Three-quarters of it goes to individuals and employers, Linking Words
while
exactly a quarter would be given to taxpayers.Linking Words