IELTS Academic Writing Task 1 Tables Topics 2026
This list contains a selection of IELTS Academic Writing Task 1 tables topics that were submitted by students who completed the IELTS exam in 2026. Select a topic at random and start practicing and enhancing your writing abilities.
tables
The tables give information about the temperatures and hours of daylight in London and Sydney during the same weekend in December 2018. Summarise the information by selecting and reporting the main features, and make comparisons where relevant. Temperature and Daylight Hours Temperature and Daylight Hours


tables
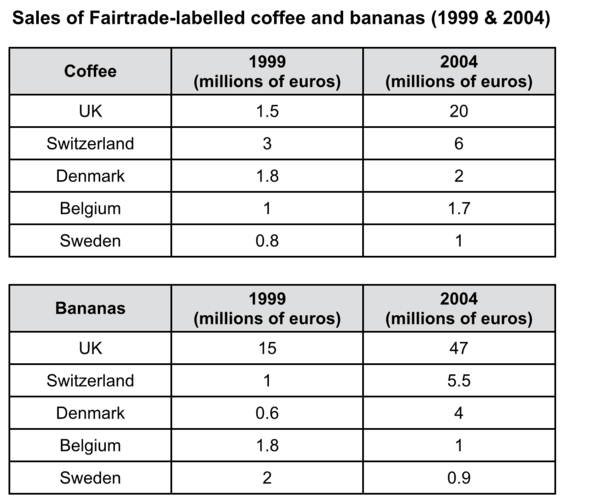
The tables below give information about sales of Fairtrade-labelled coffee and bananas in 1999 and 2004 in five European countries. Summarise the information by selecting and reporting the main features, and make comparisons where relevant.


tables
The tables below provide information about the consumption and production of potatoes in five parts of the world in 2006. Summarize the information by selecting and reporting the main features, and make comparisons where relevant.


tables
The tables below show responses to a questionnaire given by two groups of people (club members and the general public) who showed their opinions about a new theatre. Summarize the information by selecting and reporting the main points and making comparisons where relevant.


tables
The tables give information about the average hours work by part-time and full-time men and women in three countries in Europe in 2002 and compare them with the European countries.


tables
The tables give information about the temperatures and hours of daylight in London and Sydney during the same weekend in December 2018. Summarise the information by selecting and reporting the main features, and make comparisons where relevant.

tables
The tables below give information about sales of fair trade-labelled coffee and bananas in 1999 and 2004 in five European countries. Summarise the information be selecting and reporting the main features, and make comparison where relavent.

tables
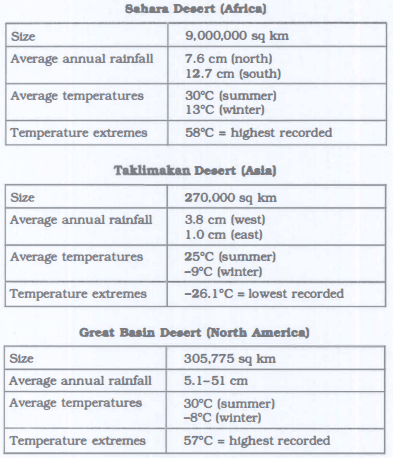
The charts below show information about three different deserts around the world. Summarize the information by selecting and reporting the main information and making comparisons.

tables
The tables below give information about sales of Fairtrade-labelled coffee and bananas in 1999 and 2004 in five Europ

tables
The tables give information about sales of Fairtrade-labelled coffee and bananas in 1999 and 2004 in five countries.
tables
The diagrams below show the results of a survey from Taiwan explaining how students, wanting to study overseas, chose a university from 1998-2008.


tables
The tables give information on the temperatures and the hours of daylight in two particular cities in the same week in May 2007. Summarize the information by selecting and reporting the main features, and make comparisons where relevant.

tables
The two tables below show the exchange students from universities in Europe to Australia between 2007 and 2009.


tables
task one: the two tables here show the percentages of smokers in different age groups. Please summarize and compare the information.

tables
The tables below give information about sales of Fairtrade-labelled coffee and bananas in 1999 and 2004 in five Europen countries

tables
The tables give information about the temperatures and hours of daylight in London and Sydney during the same weekend in December 2018.


tables
The 2 given tables illustrate the number of Fairtrade-labelled coffee and bananas across 5 countries over a 5 years period, from 1999 to 2004.

tables
The tables below give information about sales of Fairtrade*-labelled coffee and bananas in 1999 and 2004 in five European countries.

tables
The two tables below show the exchange students from universities in Europe to Australia between 2007 and 2009. Summaries the information by selecting and reporting the main features, and make comparisons where relevant.

tables
The tables below give information about sales of Fairtrade-labelled coffe and bananas in 1999 and 2004 in five European countries. Summarize the information by selecting and reporting the main features, and make comparisons where relevant

tables
The tables show the sales of fairtrade-labelled coffee and bananas in 1999 and 2004 Summarise the information by selecting and reporting the main features, and make comparisons where relevant.

tables
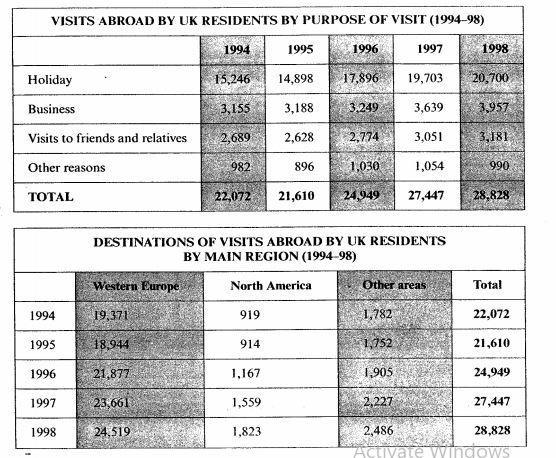
The first chart below shows the results of a survey which sampled a cross-section of 100,000 people asking if they traveled abroad and why they traveled for the period 1994-98.

tables
The graph gives information about coffee production in 4 different countries from 1990 to 2010. Summarize the information by selecting and reporting the main features and make comparizons where relevant
tables
The tables below give information about the amount of exports (millions of tonnes) moving through Rotterdam port in Holland to various global destinations in 2002 and 2012; and also, the % rates of tax imposed on these exports by the receiving countries.


tables
The tables below give information about sales of Fairtrade-labelled coffee and bananas in 1999 and 2004 in five European countries. Summary the information by selecting and reporting the main features and make comparisons where relevant.


tables
The tables below give information about sales of fairtrade labeled coffee and bananas in 1999 and 2004 in five European countries.


tables
The tables below give information about the amount of beer and fruit juice consumed per person per year in different countries. Summarise the information by selecting and reporting the main features, and make comparisons where relevant.


tables
The tables below give information about sales of Fairtrade-lebelled coffe and bananas in 1999 and 2004 in five European countries. Summarise the information by selecting and reporting the main features, and make comparisons where relevant

tables
The tables give information sales of fairtrade labelled coffee and bananas in 1999 and 2004 in five European countries. Summarise the information by selecting and reporting the main features, and make comparisons where relevant.

tables
The charts below show the level of participation in education and science in developing and industrialised countries in 1980 and 1990. Write a report for a university lecturer describing the information shown below.


tables
The tables below give information about sales of Fairtade- labelled coffee and bananas in 1999 and 2004 in five European countries. Summsrise the information by selecting and reporting the main features, and make comparison where relevant.

tables
the tables show how many interntational students studies in Canada and the United States by country of origin


tables
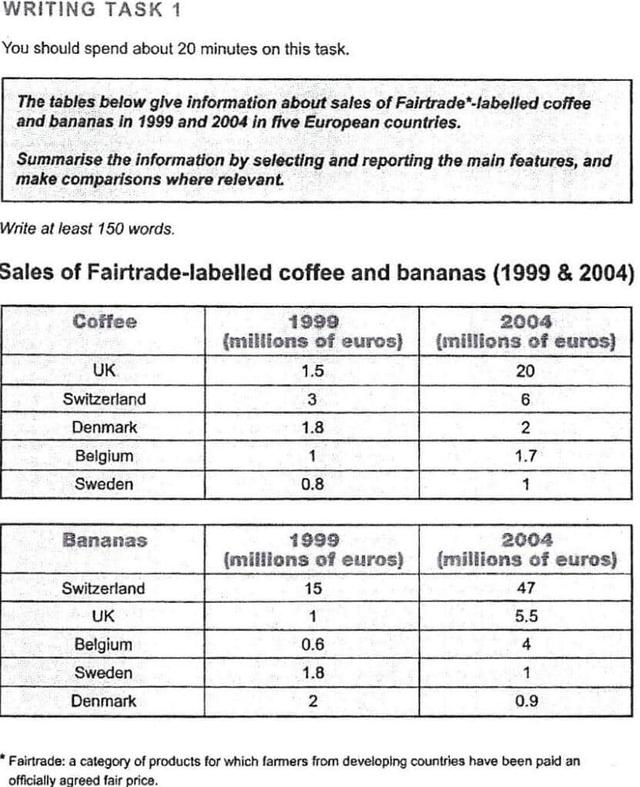
The tables below give information about sales of Fairtrade*-labelled coffee and bananas in 1999 and 2004 in five European countries. Summarise the information by selecting and reporting the main features, and make comparisons where relevant. *Fairtrade: a category of products for which farmers from developing countries have been paid an officially agreed fair price.

tables
The tables below give information about the production and consumption of coffee in 2017 and 2018 in five coffee-exporting countries. Summarise the information by selecting and reporting the main features, and make comparisons where relevant.


tables
The tables below give information about sales o f Fairtrade* - labelled coffee and bananas in 1999 and 2004 in five European countries. Summarise the information by selecting and reporting the main features, and make comparisons where relevant.

tables
The tables below give information about sales of Fairtrade- labelled coffee and bananas in 1999 and 2004 in five european countries.

tables
The tables below give information about sales of Fairtrade*-labelled coffee and bananas in 1999 and 2004 in five European countries. Summarise the information by selecting and reporting the main features, and make comparisons where relevant. *Fairtrade: a category of products for which farmers from developing countries have been paid an officially agreed fair price.

tables
The tables show results of 2 surveys done in 1980 and 2010 on various aspects of city living in a particular city. Units are measured in percentage. Summarise the information by selecting and reporting the main features, and make comparisons where relevant


tables
The diagrams below show the result of a survey from Taiwan explaining how students wanting to study overseas, chose a university from 1998 - 2008.

tables
The charts below give information about weather in two brazilian cities. Summarise the information by selecting and reporting the main features, and make comparisons where relevant.


tables
The tables below show data about the amount of television watched by children in different countries (hours per day) and also the average academic achievement of people in these countries (% of people completing each level). Write a report for a university lecturer describing the information shown below, and make comparisons where relevant.


tables
The tables show results of 2 surveys done in 1980 and 2010 on various aspects of city living in a particular city. Units are measured in percentage.

tables
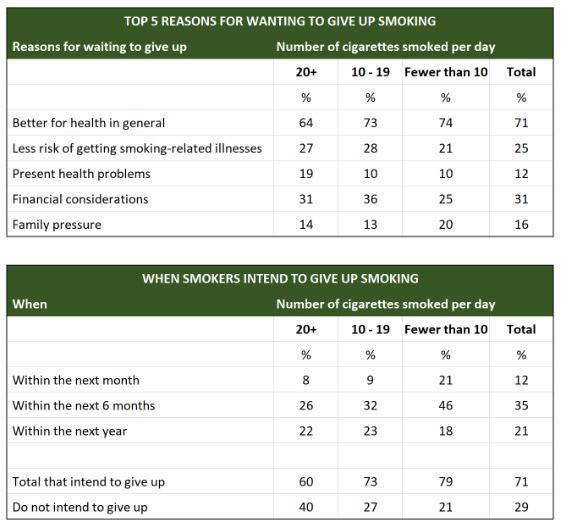
The tables below show people’s reasons for giving up smoking, and when they intend to give up. Summarise the information by selecting and reporting the main features, and make comparisons where relevant.


tables
The tables give information about sales of Fairtrade-labelled coffee and bananas in 1999 and 2004 in five European countries. Summarise the information by selecting and reporting the main features, and make comparisions where relevant.

tables
the following tables show the average price of a Big Mac and a can of Coca-Cola (in US dollars) in five countries in 1990 and 2000


tables
The tables below give information about sales of Fairtrade*-labelled coffee in 1999 and 2004 in five European countries. Summarise the information by selecting and reporting the main features, and make comparisons where relevant.

tables
The tables below gives information about the changes in the military budgets of 8 countries between 2004 and 2020.


tables
The tables provides data about the percentage of prduction quality, information about the plays/ performances to the public, and facilities in the threatre were rated by club memebers and the general public to a questionaire.
tables
The tables below give information about sales of Fairtrade*- labelled coffee and bananas in 1994 and 2004 in five European countries.
tables
The diagram below shows the floor plan of a public library 20 years ago and how it looks now. Summarise the information by selecting and reporting the main features, and make comparisons where relevant. Wite at least 150 words.


tables
The two tables below show statistics of workers of foreign and US birth in the United States last year. Summaries the information by selecting and reporting the main features, and make comparisons where relevant.


tables
Test 35 question The tables below show people's reasons for giving up smoking, and when they intend to give up. Summarize the information by selecting and reporting the main features, and make comparisons where relevant.

tables
The graphs below show the number of drivers in Britain who have been caught driving too fast by speed cameras placed on roads, and the numbe of people killed in road accidents, over an eight-year period since the introduction of speed cameras. The tables show the results of a survey on people’s opinion on speed cameras. Write a report for a university lecturer describing the information below


tables
The tables below give information about sales of Fairtrade- labelled coffee ans bananas in 1999 and 2004 in five European counties. Summarise the information by selecting and reporting the main features, and make comparisons where relevant.

tables
The tables below show people's reasons for giving up smoking, and when they intend to give up. Summarise the information by selecting and reporting the main features, and make comparisons where relevant.


tables
The tables below give information about sales of coffee and bananas in 1990 and 2004 in five European countries. Summerise the information by selecting and reporting the main features.

tables
The tables give information about the temperatures and hours of daylight in London and Sydney during the same weekend in December 2018. Summarise the information by selecting and reporting the main features, and make comparisons where relevant.

tables
The tables below give the information about sales of Faietrade labelled coffee and benanas in 1999 and 2004 in five Eropean countries. Summarize the information by selecting and reporting the main features and make comparisons where relevant.


tables
The tables below are the results of research, which examine the average percentage marks scored by boys and girls of different ages in several school subjects in Fancy country in 2019. Summarizes the information by selecting and reporting the main features, and make comparisons where relevant. You should write about 150 words.


tables
The tables below give information about sales of Fairtrade-labelled coffee amd bananas in 1999 and 2004 in five different European countries. Summarise the information by selecting and reporting the main features, and make comparisons where relevant.

tables
48.The charts below show the number of international students in Canada and USA in 2002 and 2003, also the changes of the increase in student population over the two years. Summarize the information by selecting and reporting the main features, and make comparisons where relevant


tables
The tables show the milk and butter fat percentages among different ages. Summarize the information by selecting and reporting the main features, and make comparisons where relevant.


tables
The charts below show what UK graduate and postgraduate students who did not go into full time work did after leaving college in 2008.


tables
The tables below give information about sales of Fairtrad-labelled coffe and bananas in 1999 and 2004 in five European countires.

tables
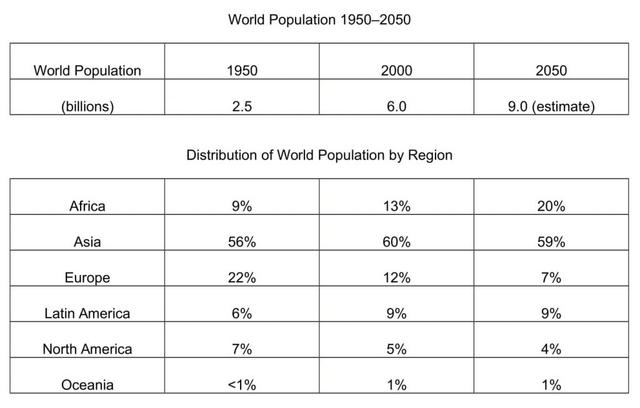
The tables below give information about the world population and distribution in 1950 and 2000, with an estimate of the situation in 2050. Summarise the information by selecting and reporting the main features, and make comparisons where relevant.


tables
The given tables illustrate the number of exchange students from Europe universities to Australian universities and vice versa in 2007 and 2009.


tables
The tables below show how much chalk an average school classroom consumes in South America over 10 years


tables
The tables below give information about sales of Fairtrade-labelled coffee and bananas in 1999 and 2004 in five European countries. Summarise the information by selecting and reporting the main features, and make comparisons whererelevant.

tables
The tables below illustrate the number of students who have come from China, America and India to study in the USA or Canada in 2002 and 2003.

tables
The graphs below give information about computer ownership as a percentage of the population between 2002 and 2010, and by level of education for the years 2002 and 2010.


tables
The tables below give information about sales of Fairtrade*-labelled coffee and bananas in 1999 and 2004 in five European countries. Summarize the information by selecting and reporting the main features, and make comparisons where relevant

tables
the tables below shows people's reasons for giving up smoking and when they intent to give up.

tables
The tables below give information about the average number of iPhones and Samsung phones sold each day in 5 countries during 2010 and 2020.


tables
Some people say that now we can see films on our phone or tables there is no need to go cinema. Other say that to be fully enjoyed films need to seen in a cinema. Discuss both views and give your opinion.

tables
You are advised to spend about 20 minutes on this task. The tables below give information about sales of Fairtrade*-labelled coffee and bananas in 1999 and 2004 in five European countries. Summarise the information by selecting and reporting the main features, and make comparisons where relevant. »

tables
The two tables below show responses of different age groups to a questionnaire with their opinion about the range of books and the non-print materials in a local library.


tables
The tables below show the results of a survey on people's satisfaction about a local library. Summarise the information by selecting and reporting the main features and make comparisons where relevant.


tables
The tables below give information about the consumption and production of potatoes in different world regions in 2006. Summarize the information by selecting and reporting the main features, and make comparisons where relevant
tables
The tables below provide information about the consumption and production of potatoes in five parts of the world in five parts of the world in 2006.


tables
The tables below give information about the world population and distribution in 1950 and 2000, with an estimate of the situation in 2050. Summarise the information by selecting and reporting the main features, and make comparisons where relevant.

tables
The tables below give information about the amount of beer and fruit juice consumed per person per year in different countries.


tables
The tables below give information about the world population and distribution in 1950 and 2000, with an estimate of the situation in 2050.


tables
the tables below give information about sales of fairtrade-labelled coffee and bananas in 1999 and 2004 in 5 european countries. Summarise the information by selecting and reporting the main features, and make comparision where relevant

tables
The tables below give information about sales of Fair trade- labelled tea and pineapples in 2010 and 2015 in five European countries. Summarise the information by selecting and reporting the main features, and make comparisons where relevant.


tables
The tables below give information about the consumption and production of potatoes in different world regions in 2006. Summarise the information by selecting and reporting the main features, and make comparisons where relevant

tables
The tables show the transformation that have taken area at Queen Mary Hospital since it is construction in 1960.


tables
The tables below give information about sales of fair trade labelled coffee and bananas in 1999 and 2004 in five European countries

tables
The tables show how many international student studies in canada and the united states by country of origin

tables
The tables below show the distribution of students at UK universities by mode of study and gender. Summarise the information by selecting and reporting the main features, and make comparisons where relevant.


tables
The two tables below show the exchange students from universities in Europe to Australia between 2007 and 2009. Summaries the information by selecting and reporting the main features, and make comparisons where relevant.

tables
the chart below shows the value of one country's exports in various categories during 2015 and 2016. The tables shows the percentage in each category of exports in 2016 compared to 2015


🚀 Prepare for IELTS writing section today!
- Unlimited Task 1 & Task 2 checksPractice with essays, charts, and letters.
- Personalized suggestions & mistake analysisSpot every mistake and boost your score.
- Topic ideas & vocabulary helpersExpand your ideas and use the right words.
- Progress trackingWatch your writing improve with every practice.