
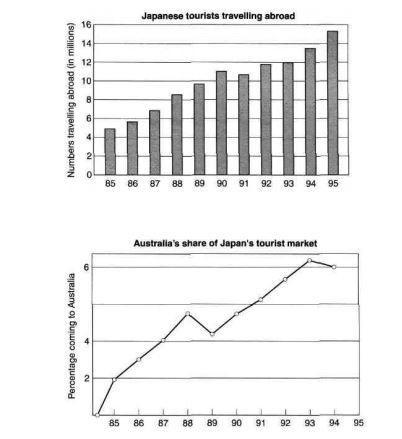
The bar chart compares the figures for Japanese visitors migrating overseas from 1885 to 1995,
while
the line graph shows the revenue Linking Words
Australia
received from Japan's tourist market.
Use synonyms
Overall
, it is evident that the Linking Words
number
of o
Japanese tourists grew gradually throughout the period. It can Use synonyms
also
be observed from the line graph that Linking Words
Australia
's income from business increased steadily over the time frame.
Use synonyms
According to
the bar chart around 5 Linking Words
million
Japanese visitors travelled in 1885 to abroad. Their figures kept on increasing each year, by 1890 they recorded around 11 Use synonyms
million
explorers moving overseas. Their trend dropped to approximately 10.5 Use synonyms
million
the following year. ,The Use synonyms
number
of explorers started to increase steadily for a Use synonyms
while
before experiencing significant growth. In 1995 the Linking Words
number
of visitors had grown substantially to about 15.2 Use synonyms
million
which was by far the highest Use synonyms
number
.
With regards to the line graph, before 1885 Use synonyms
Australia
recorded a negligible amount of profit from Japan's tourist business. Use synonyms
This
began to change as they received 2% of the revenue generated in 1885. Linking Words
Furthermore
, Linking Words
Australia
's part of the explorers' money witness an upward movement, Use synonyms
although
it fluctuate at some point before it continuously increased to perk at around 6.2% in 1993. In 1994 their earning declined slightly to 6%, there were no records of Linking Words
Australia
's part of the tourist business in 1995.Use synonyms