
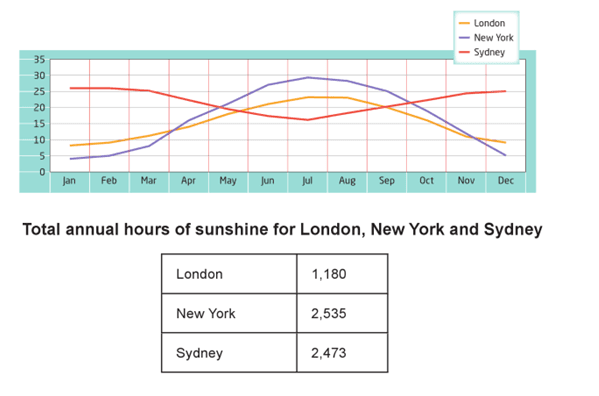
The given graphic and table illustrate the median temperatures per month and the average number of hours of sunlight yearly in three metropolises.
Overall
, considering the reported cities, it is true to say that climate and warmth correlate to total hours of sunshine per annum to a great extent.
By far, an important temperature fluctuation is experienced by the state of New York, where numbers start as low as 5 Linking Words
C
in January and peak in July, at Use synonyms
the
close proximity Correct article usage
apply
of
the 30 Change preposition
to
C
mark. Use synonyms
Subsequently
, the figures decrease considerably and reach 5 Linking Words
C
again by the month of December. Use synonyms
Moreover
, a similar trajectory is encountered by London, where Linking Words
local
climate culminates in July as well, Correct article usage
the local
the
temperature getting as high as 23 Change preposition
with the
C
. Use synonyms
Consequently
, the capital of Great Britain gradually cools down until it reaches 5 degrees Celsius in December.
Linking Words
On the other hand
, Sydney goes through a slow process of gradual chilliness during the first seven months of the year. The temperature drops from 26 Linking Words
C
in January to 16 Use synonyms
C
in the month of July. Afterwards, the number goes up slightly and culminates in December.
Use synonyms
Furthermore
, the combined annual hours of sunshine for Sydney and New York are extraordinarily similar, the figures being 2,473 and 2,535 respectively. Linking Words
However
, London encounters far less sunshine, the number being 1,180.Linking Words