
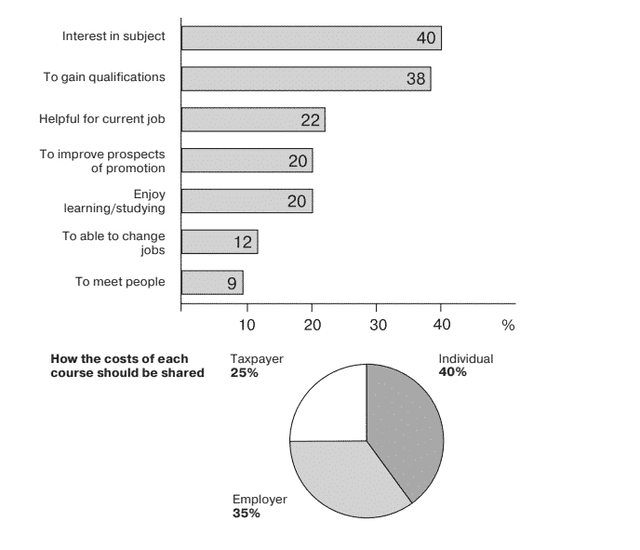
The two charts given above discussed the result of a survey about adults' education. The top graph shows why adults took a study, meanwhile, the bottom pie talks about how much of each course they took had to be shared. The amount of respondents agreeing on one issue is shown in percentages.
There are some explanations on why people chose a lecture as mentioned in the chart, from the most answered to the least are: interest in the subject, to gain qualifications, helpful for current jobs, to improve prospects of promotions, enjoy learning or studying, to able to change jobs, and to meet people. Out of these, we can conclude that a lot of the reasons are career-related,
however
, curiousness and passion about a subject is the most favourite (up to 40%). Linking Words
On the other hand
, going back to school is not the go-to place for people who want to build more networking (only 9%).
Moving on, talked about the payment that the candidates have to make Linking Words
on
a study. The best answer, which the candidates picked, up until 40% answered individual shares. The next one is employer shares in 35%, Change preposition
for
finally
, the taxpayer only accounts for up to 25%.Linking Words