
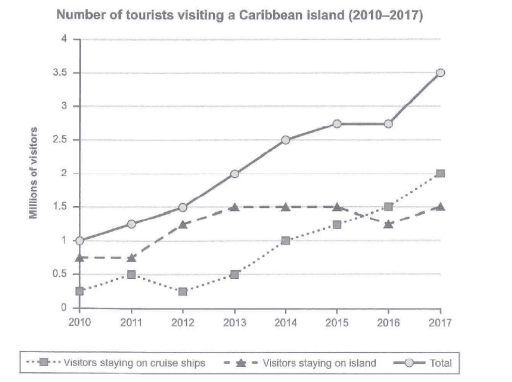
The graph clarified the figures of those people who visited a Caribbean
island
in 2010_2017. Use synonyms
Overall
, there are gradual increase in the number of Linking Words
visitors
in that period.
Use synonyms
Firstly
, visiting the Linking Words
island
those Use synonyms
visitors
who were staying on cruise ships witnessed a stunning rise in the number of Use synonyms
visitors
in that period. Use synonyms
For instance
, the percentage of Linking Words
visitors
in 2010 was 0.3% and completely increased to 2% in 2017. Use synonyms
In addition
, visiting the Linking Words
island
by those Use synonyms
visitors
who were staying on the Use synonyms
island
found an exciting rise in figures of Use synonyms
visitors
in that period. Use synonyms
For example
, the proportion of Linking Words
visitors
in 2010 was 0.7% and totally dropped to 1.5% in 2017. Use synonyms
Moreover
, the total of Linking Words
visitors
in 2010 was estimated at 1% and changed in 2017 to 3.5 %.
We notice from the graph there is a large number of Use synonyms
visitors
from cruise ships compared to Use synonyms
visitors
staying on the Use synonyms
island
and Use synonyms
this
increased by about 1%Linking Words