
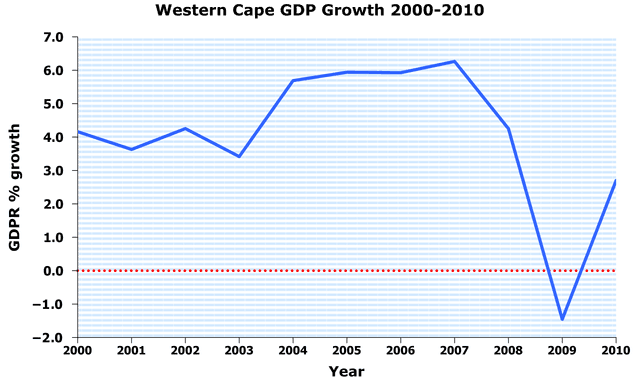
The line chart illustrates the trends in the gross domestic product(
GDP
) in the Western Cape Use synonyms
during
2000 and 2010. Change preposition
between
Overall
, the Linking Words
GDP
growth increased between 2000 and 2007 until reaching the lowest growth in 2009.
Looking at the period from 2000 to 2002, the Use synonyms
GDP
had small changes of about 0.5% and values ranging from 3.5% to 4%. Use synonyms
While
the year 2003 suffered from a drop of 1%in the Linking Words
GDP
before going up in the following year.
Use synonyms
Next
, a rise in the Linking Words
GDP
can be observed in 2004. Use synonyms
Then
, the Linking Words
GDP
was almost constant between 2004 and 2007. The highest Use synonyms
GDP
was 6% in 2007. Use synonyms
This
was followed by a 2% decline in the Linking Words
GDP
in 2008 before reaching the lowest Use synonyms
GDP
of -1.5% in 2009. But the Use synonyms
GDP
started to recover in the period between 2009 and 2010.Use synonyms